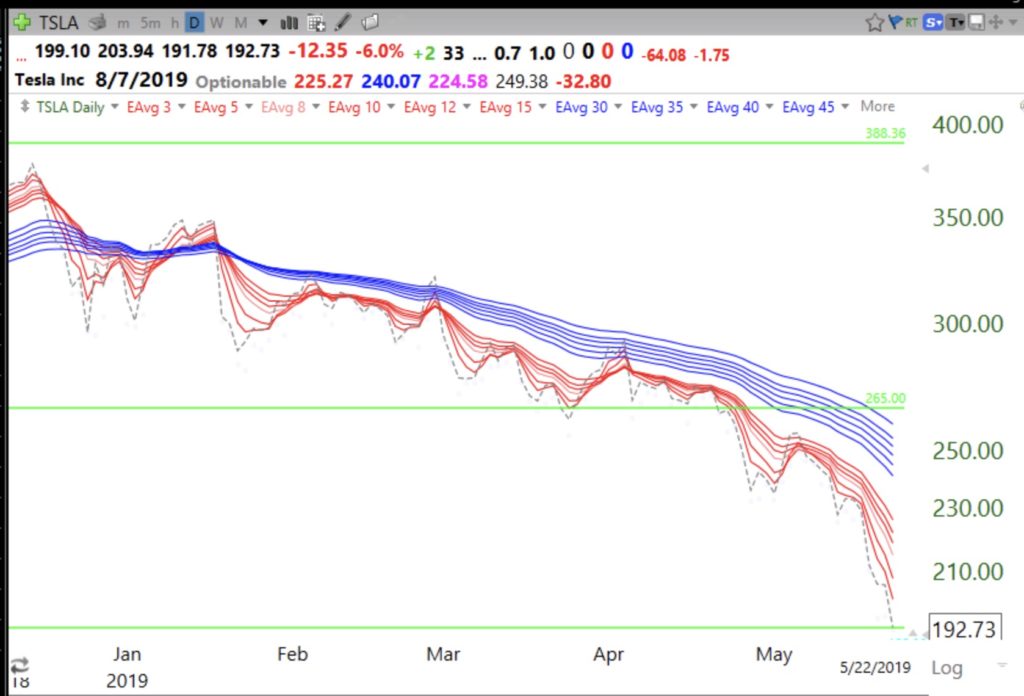
A good example of this is TSLA, which lost its RWB up-trend pattern early last December, around $347. It later entered a BWR down-trend that has continued through today, now around $192. I only buy/hold stocks in RWB up-trends (all red lines above the rising blue lines with a white space between them).
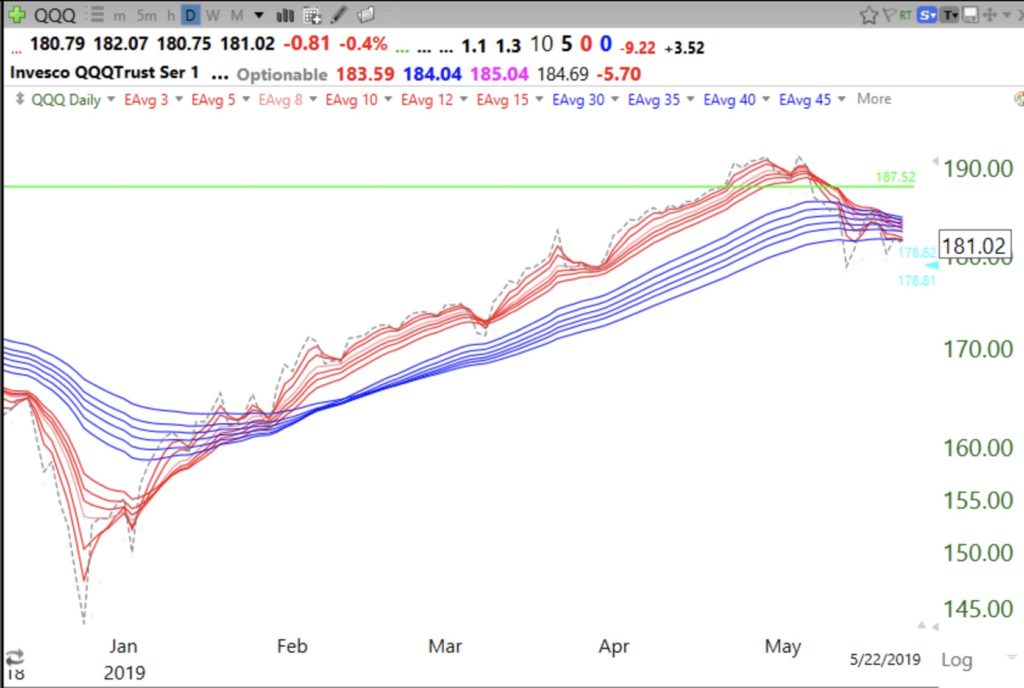
By the way, QQQ has lost its daily RWB up-trend. Will it enter a BWR down-trend?
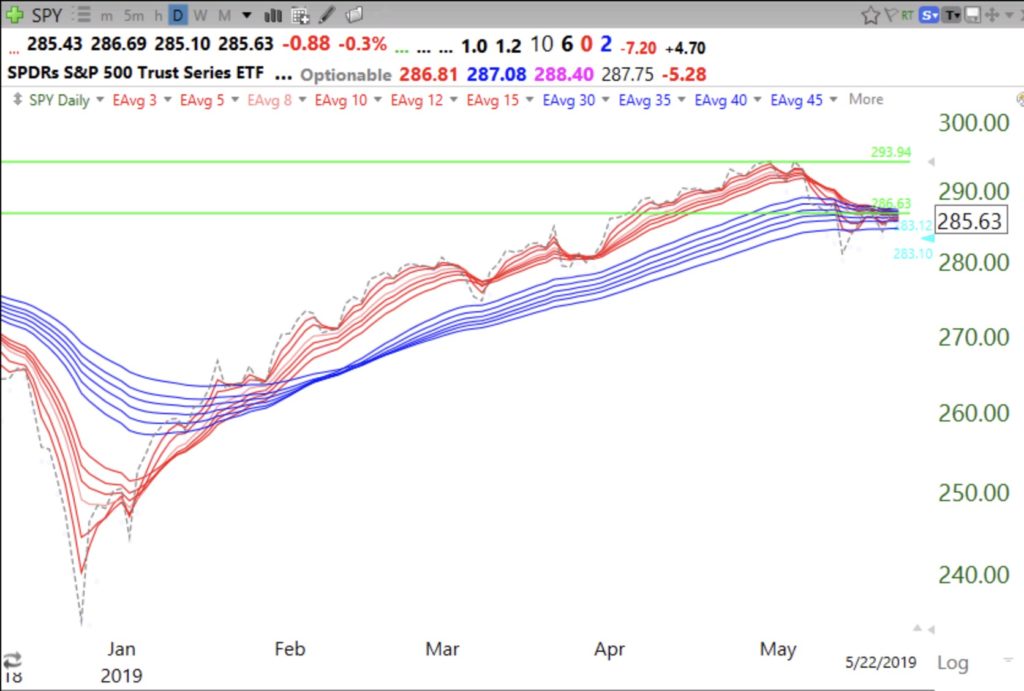
SPY has a similar pattern.


What signals the end of a daily RWB up-trend pattern? When at least one red line crosses below one blue line?
Thanks again Dr. Wish for sharing your move to CASH on May 10.
Hi Dr. Wish — I know you are cash in your trading account, but when do you go to cash in your retirement accounts? GMI-red + 3-days? Thanks!