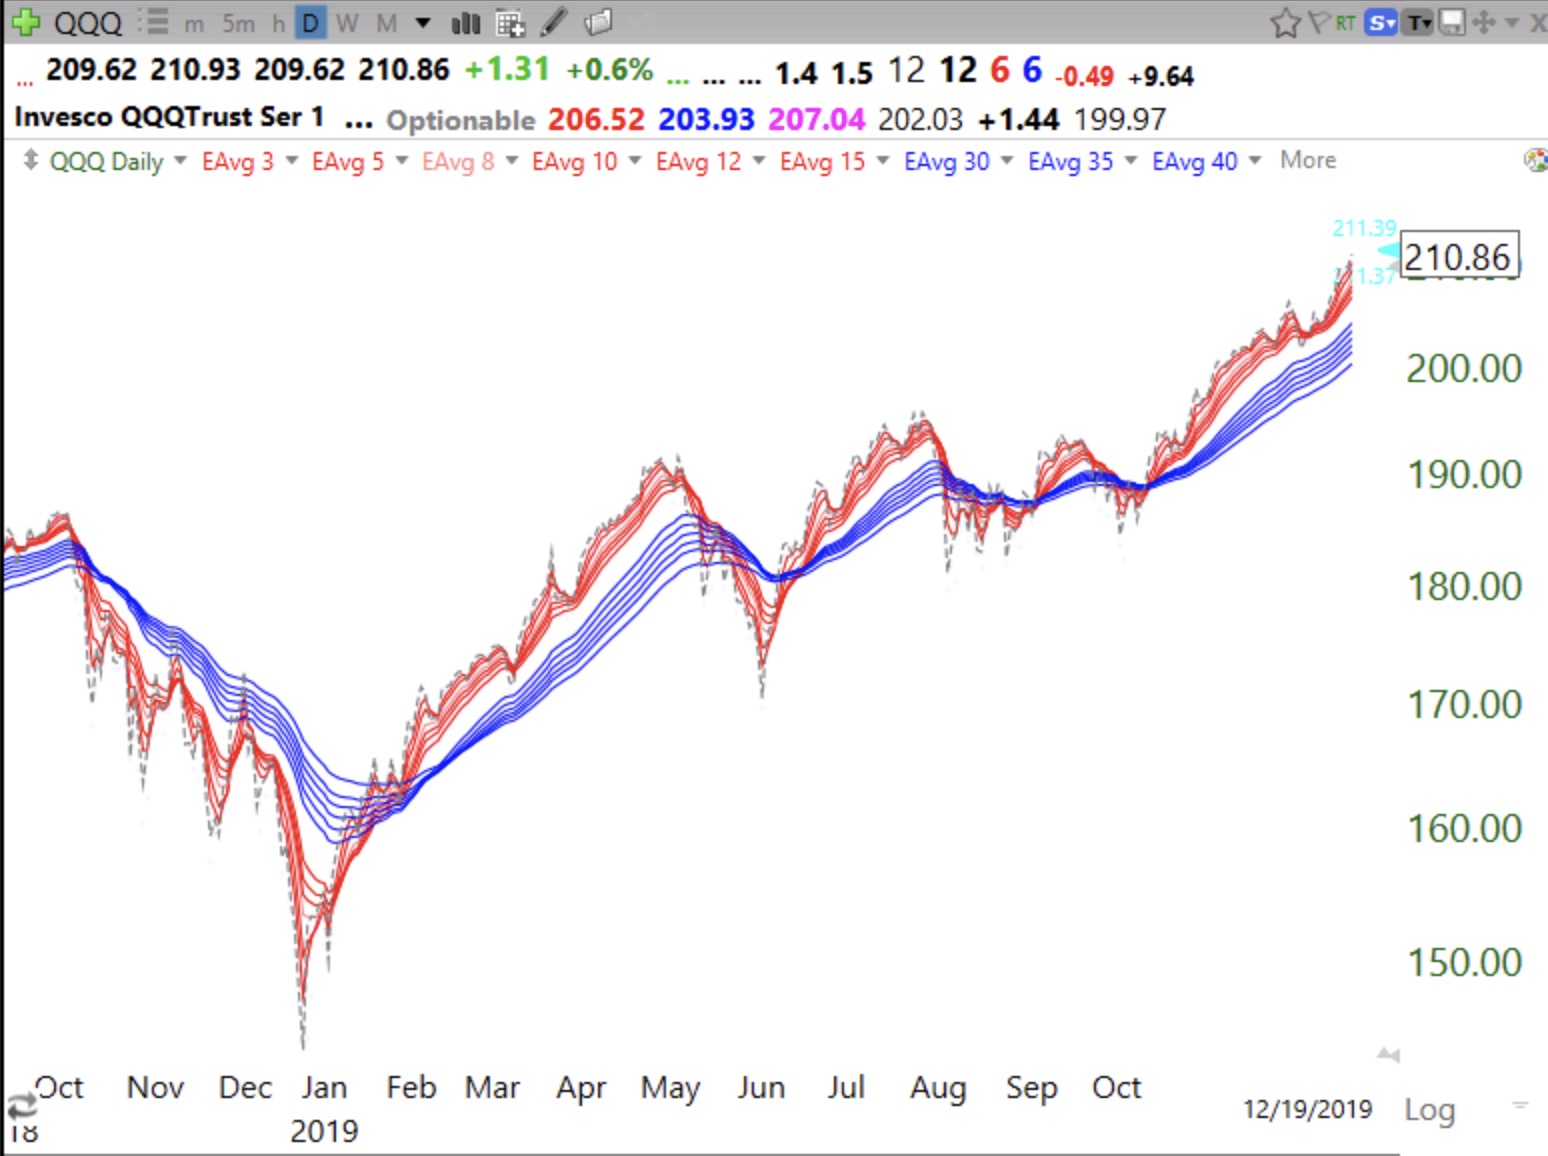
Compare the pattern October, 2018-January 2019 to the current pattern. A chart is worth a thousand+ words. The major indexes remain in daily RWB up-trends. There is usually plenty of time to get defensive when the RWB pattern (rising red averages above blue averages with a white space between them) disappears.