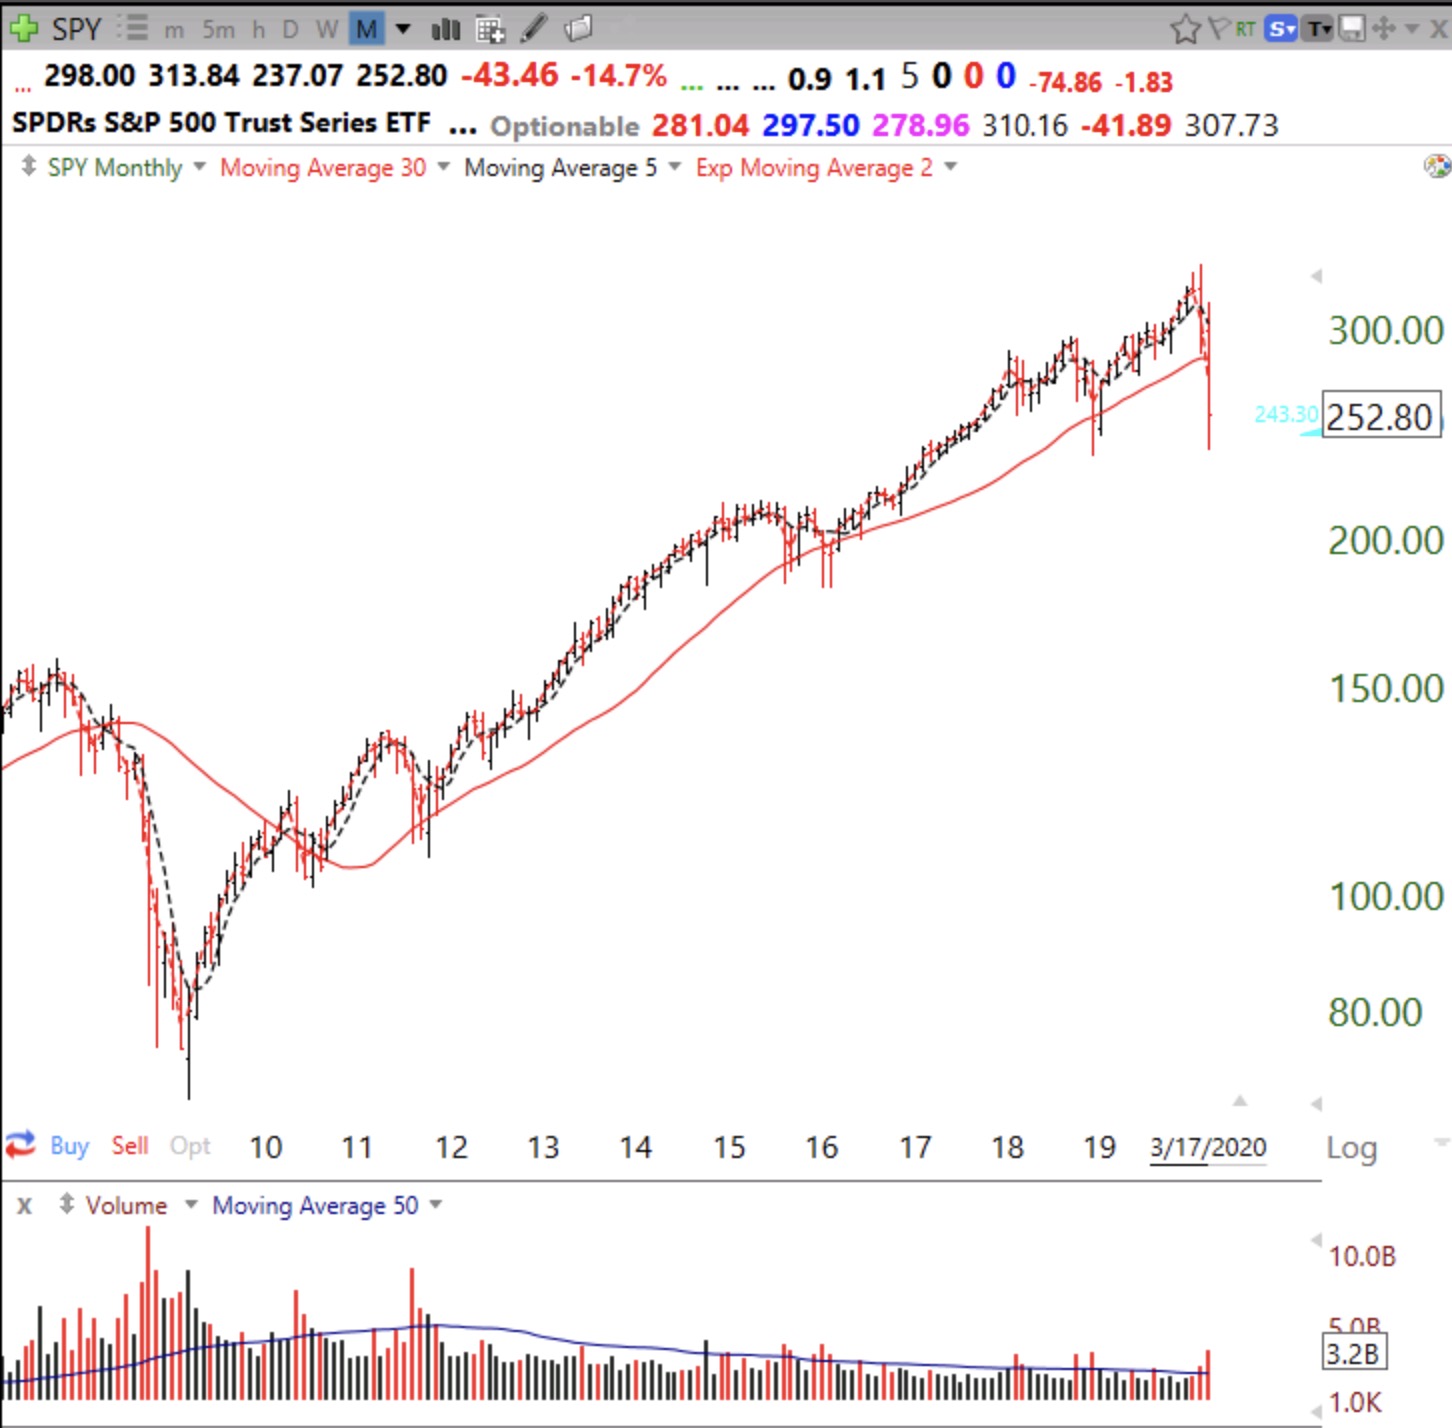
When I put this decline in context, it seems quite small thus far. Check out this monthly chart of the SPY. Compare the current decline to that in 2008. Note we have not had similar huge volume declines. I suspect a bottom will occur only after we have had a huge selling climax.
Professor, part of the reason in the volume being lower is that they didnt have circuit breakers back then, it puts a real damper on some of the volume because the trading bots cant do their “magic”. but im pretty much in full agreement with your recent analysis! (fyi old student from over 10 years ago and im still following you)
The smartest man I know.