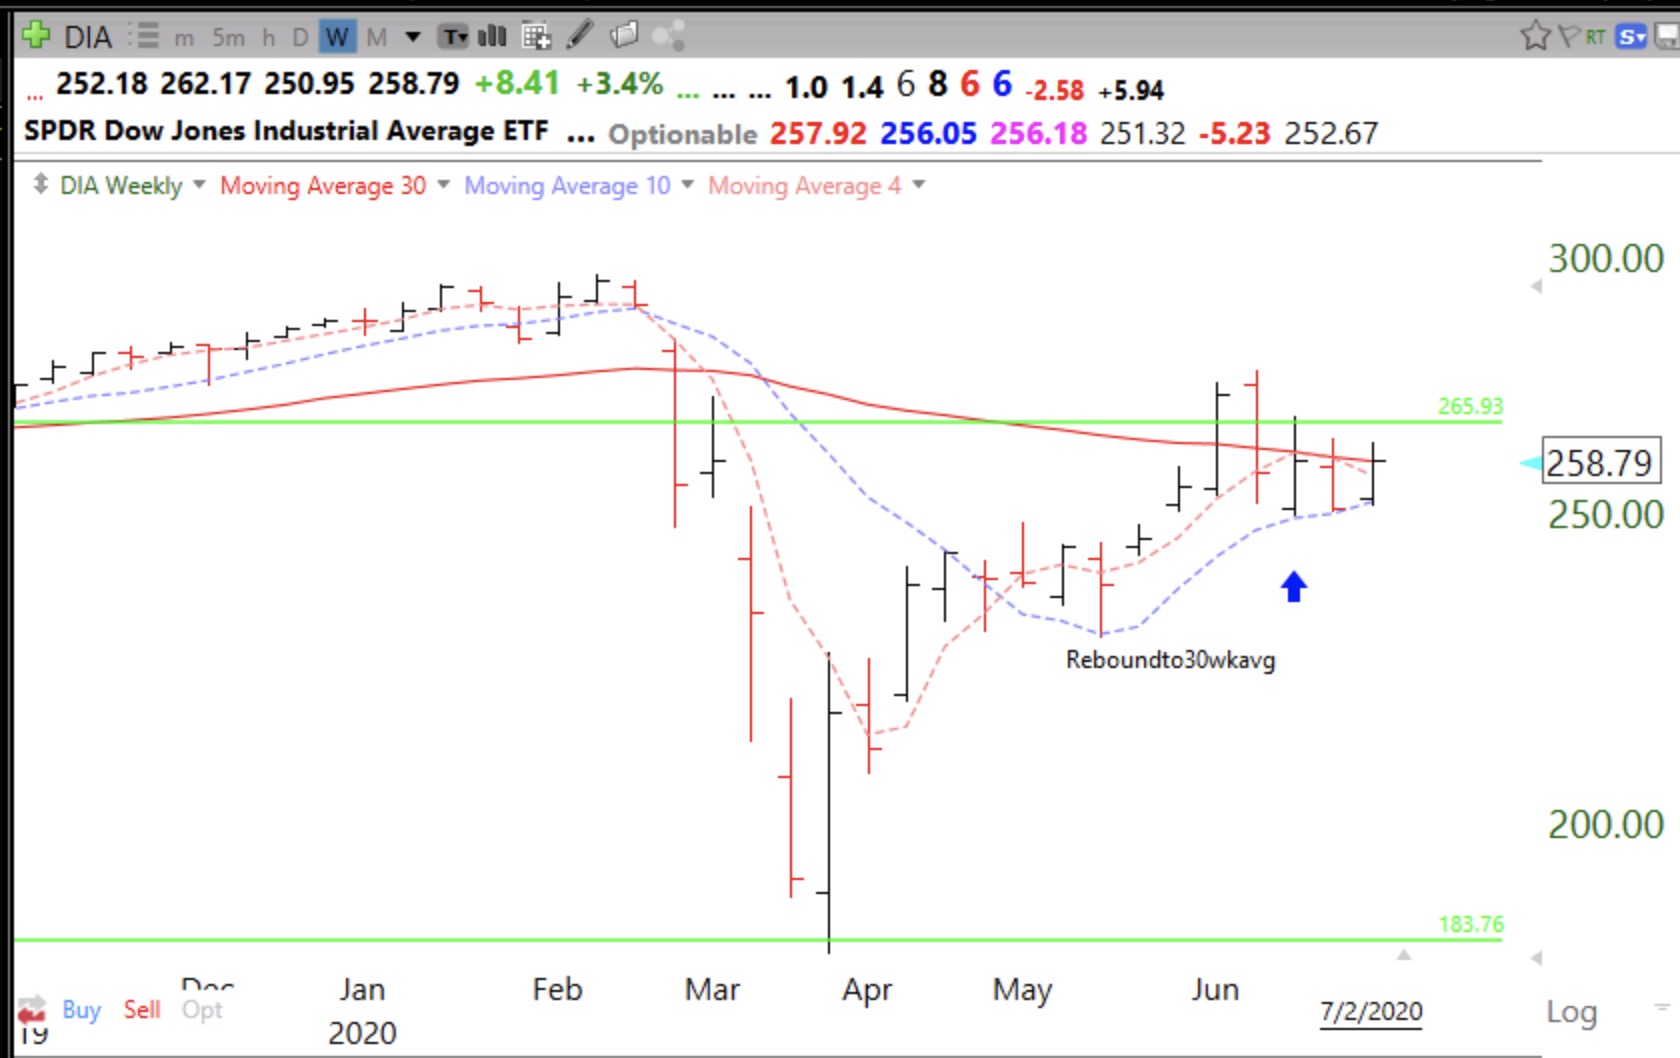
I closed out my short positions and am largely in cash until we get a resolution regarding the Dow 30 stocks. $DIA is up against its critical declining 30 week average (red line in weekly chart below). Until we get a firm close above this average, I remain super cautious. The $SPY is not much better off than the DIA. However, the one index that remains in a strong up-trend is the $QQQ.That index ETF contains many of the growth stocks that refuse to break down. If DIA can retake its green line, I think I will get back into this market. So it comes down to this question: Is the DIA a leader or a laggard in terms of the market’s trend? We shall find our soon. But remember that August and September are typically weaker months and then comes November 4, US election day.
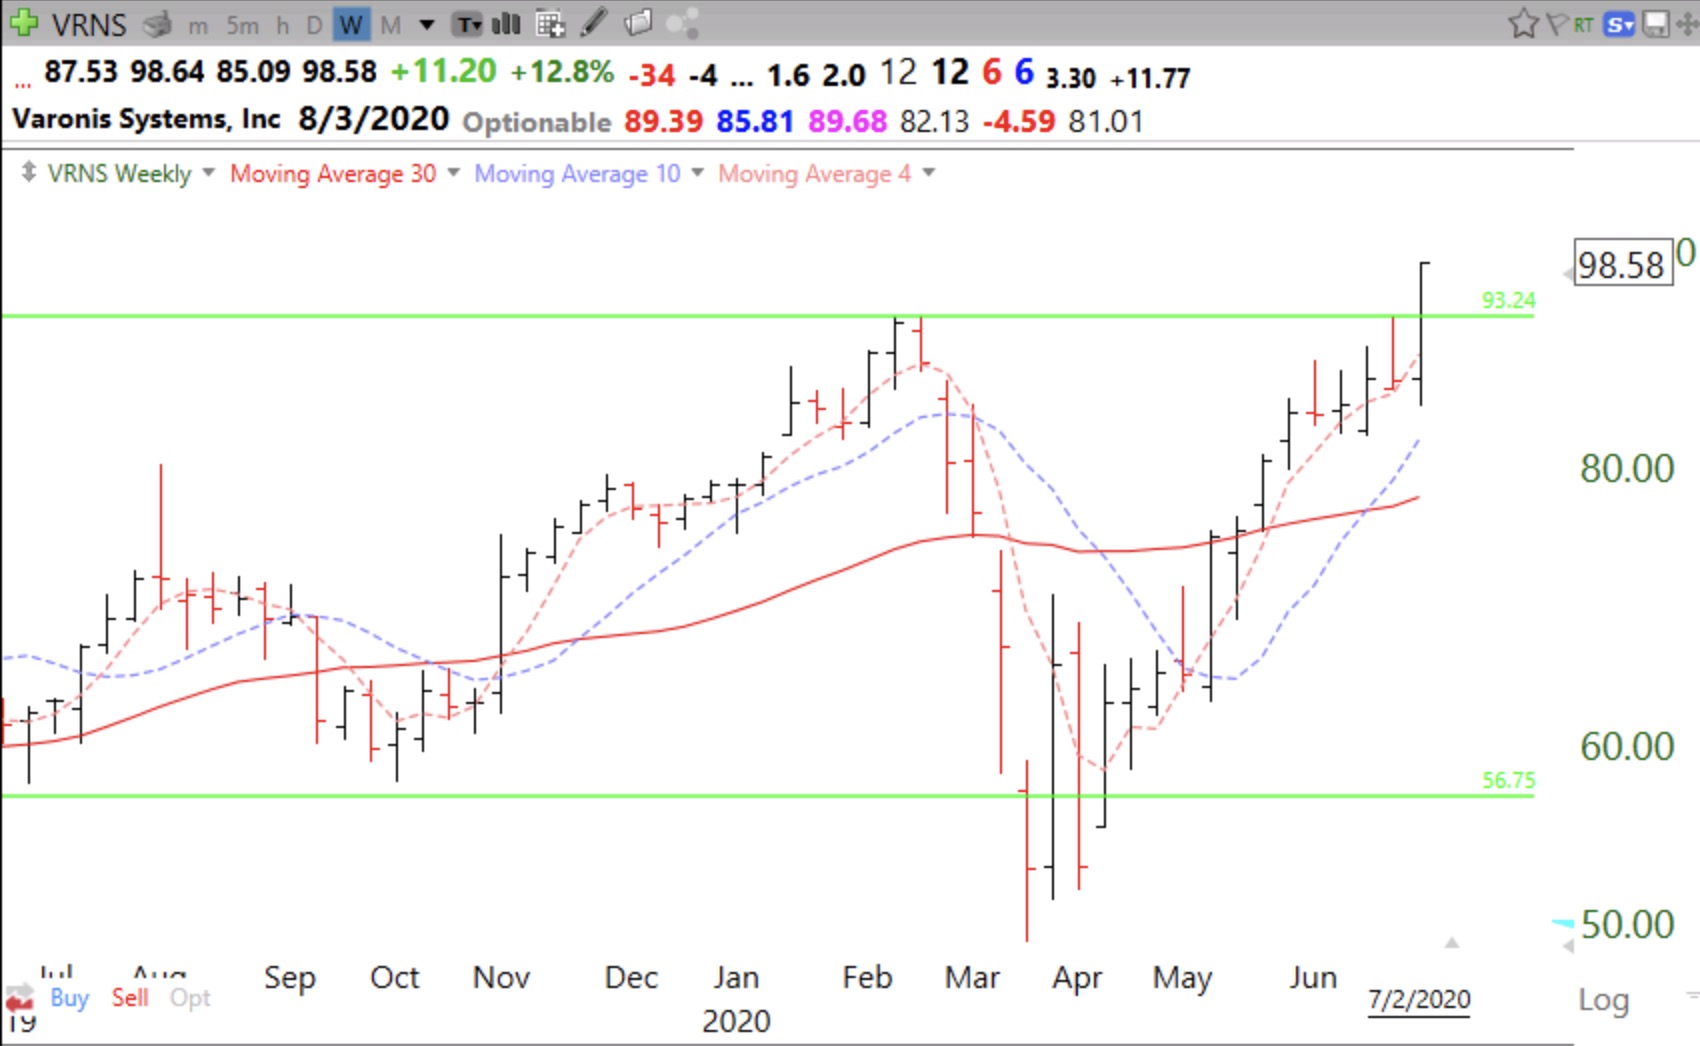
For those looking for break outs, VRNS had a GLB (green line break-out to an all-time high) last week. I sell a GLB immediately if it closes back below its green line. If it re-takes it I buy it back. Some of those are my best trades.
Hello, Prof . Tnx again for sharing with us. You wrote : “I sell a GLB immediately if it closes back below its green line. If it re-takes it I buy it back.” For the “Sell” or “Buy back” decisions, to what chart do you refer ? (Daily, weekly ?). Best regards, Pierre