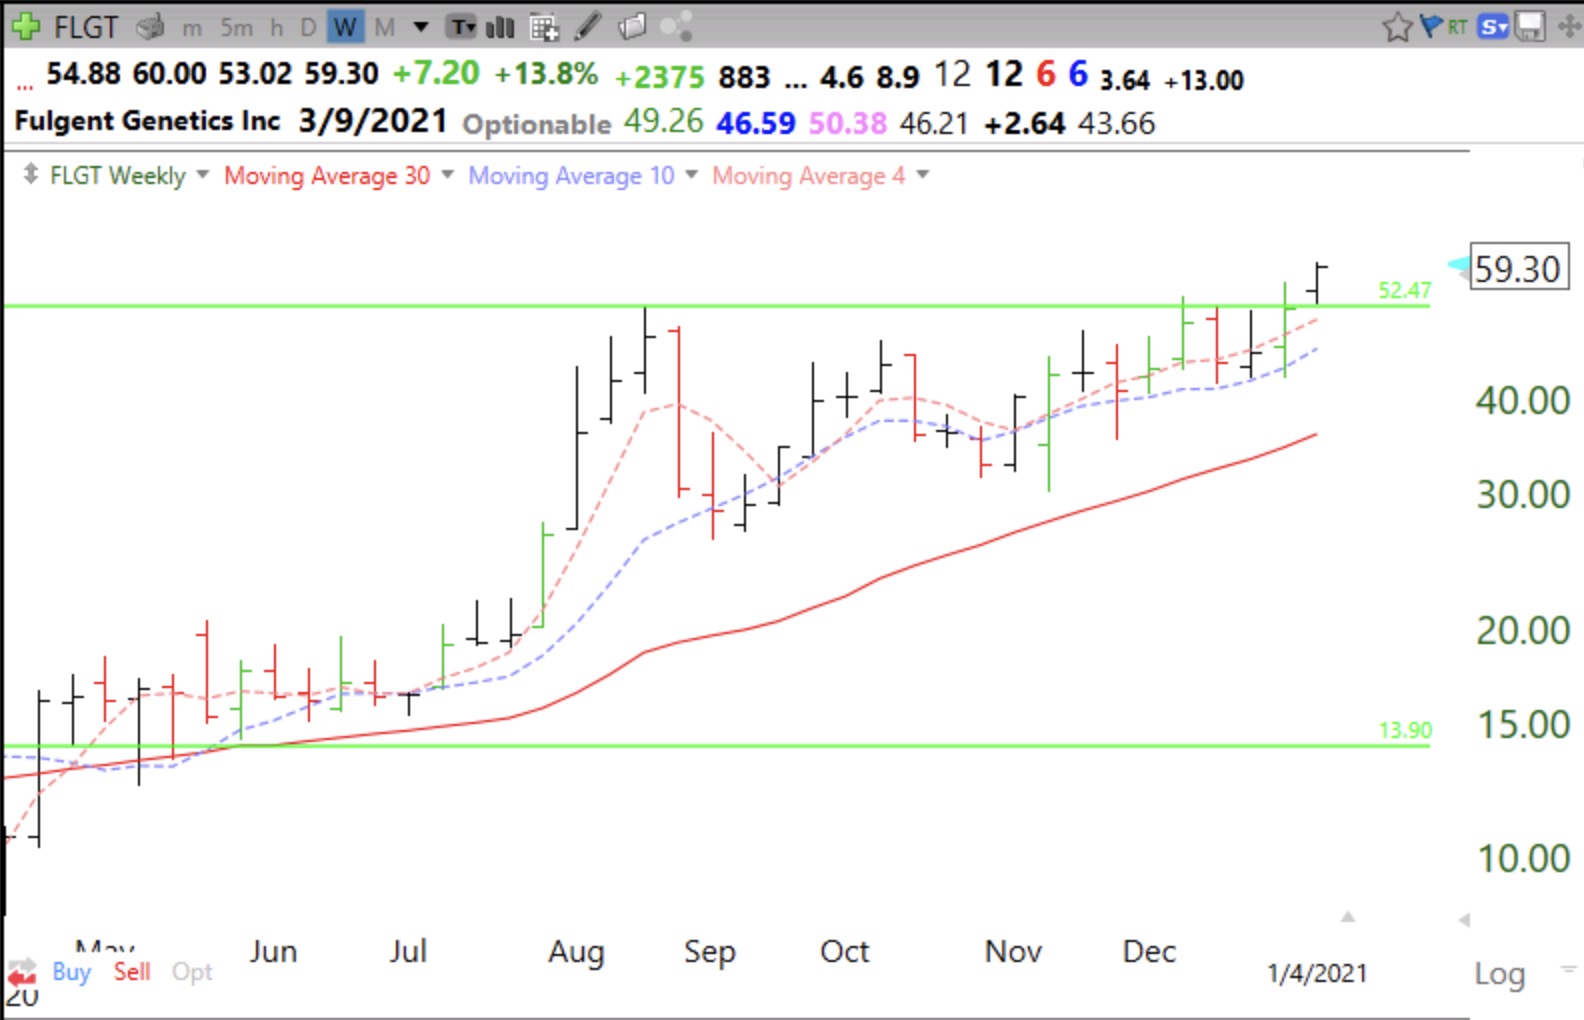
Looks like a volatility contraction pattern (VCP). Projected earnings expansion could bring PE down to 10! A close below green line would lead me to exit. GLB= green line break-out to ATH (all-time high). NYC buying their COVID-19 tests for their schools.
Hey dr wish, happy new year..! What’d u n Judy think about nvax? Would you take the vac, n think it’ll make one of those glb? =D