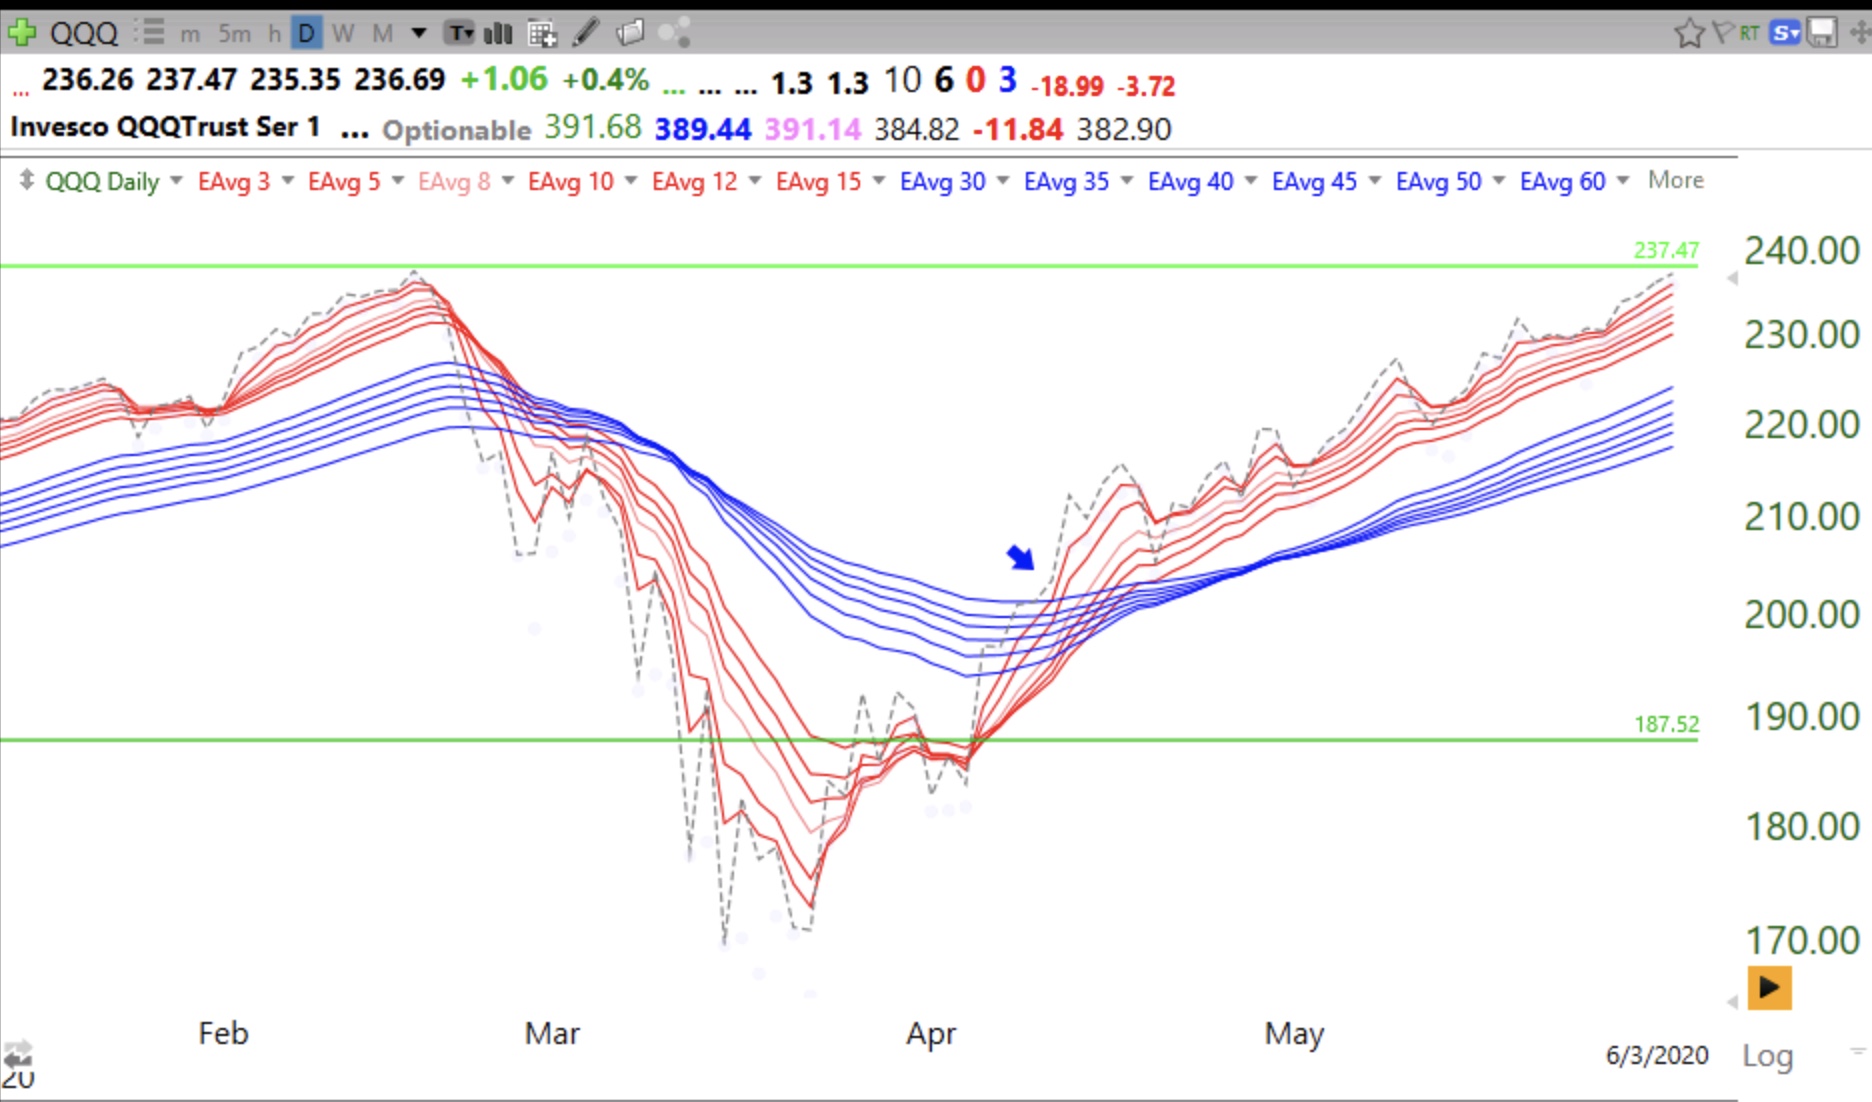
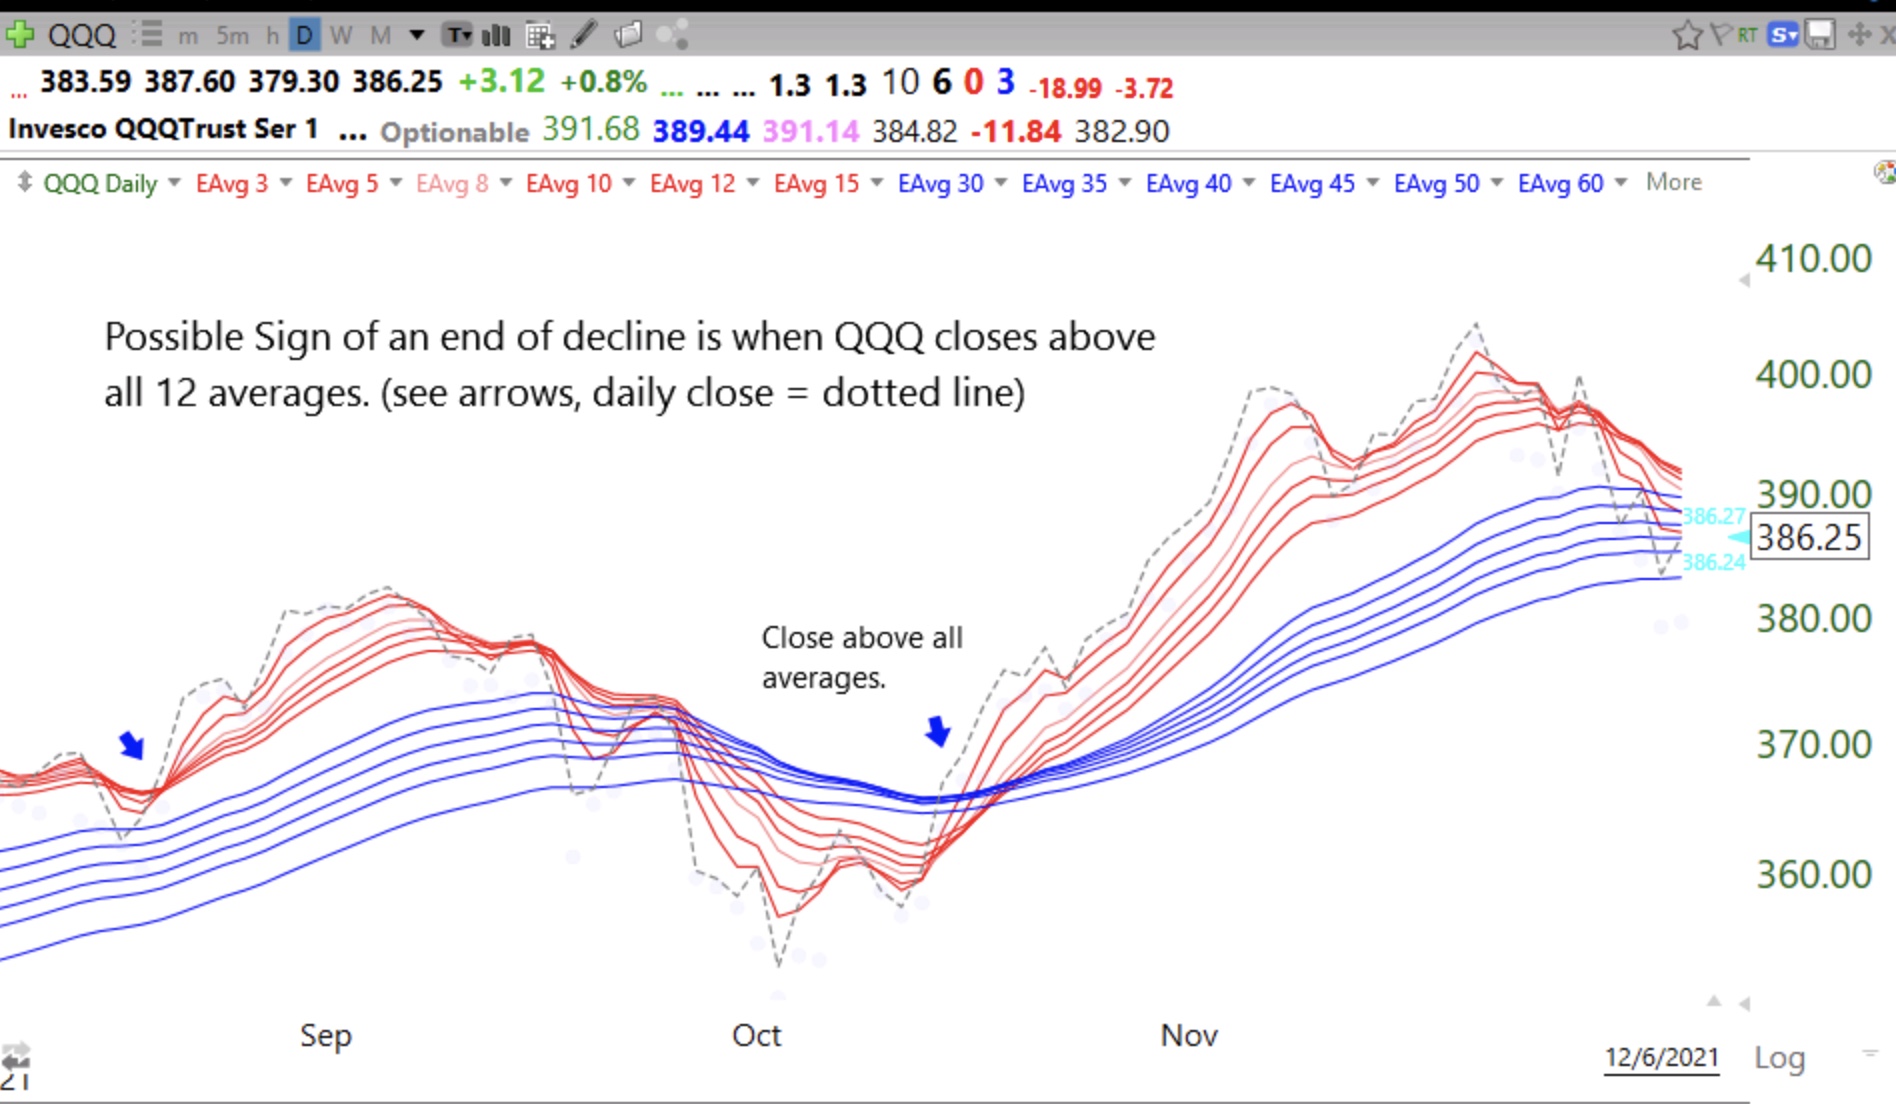
This modified GMMA daily chart shows 6 shorter term exponential moving averages (red lines) and 6 longer term averages (blue lines). I have added a dotted line that shows each daily close. After a large decline, a close back above all of the averages (shown by arrows) can signal a new up-trend. Right now we would need a close of the QQQ above 391.68.
Here is end of 2020 COVID induced decline.