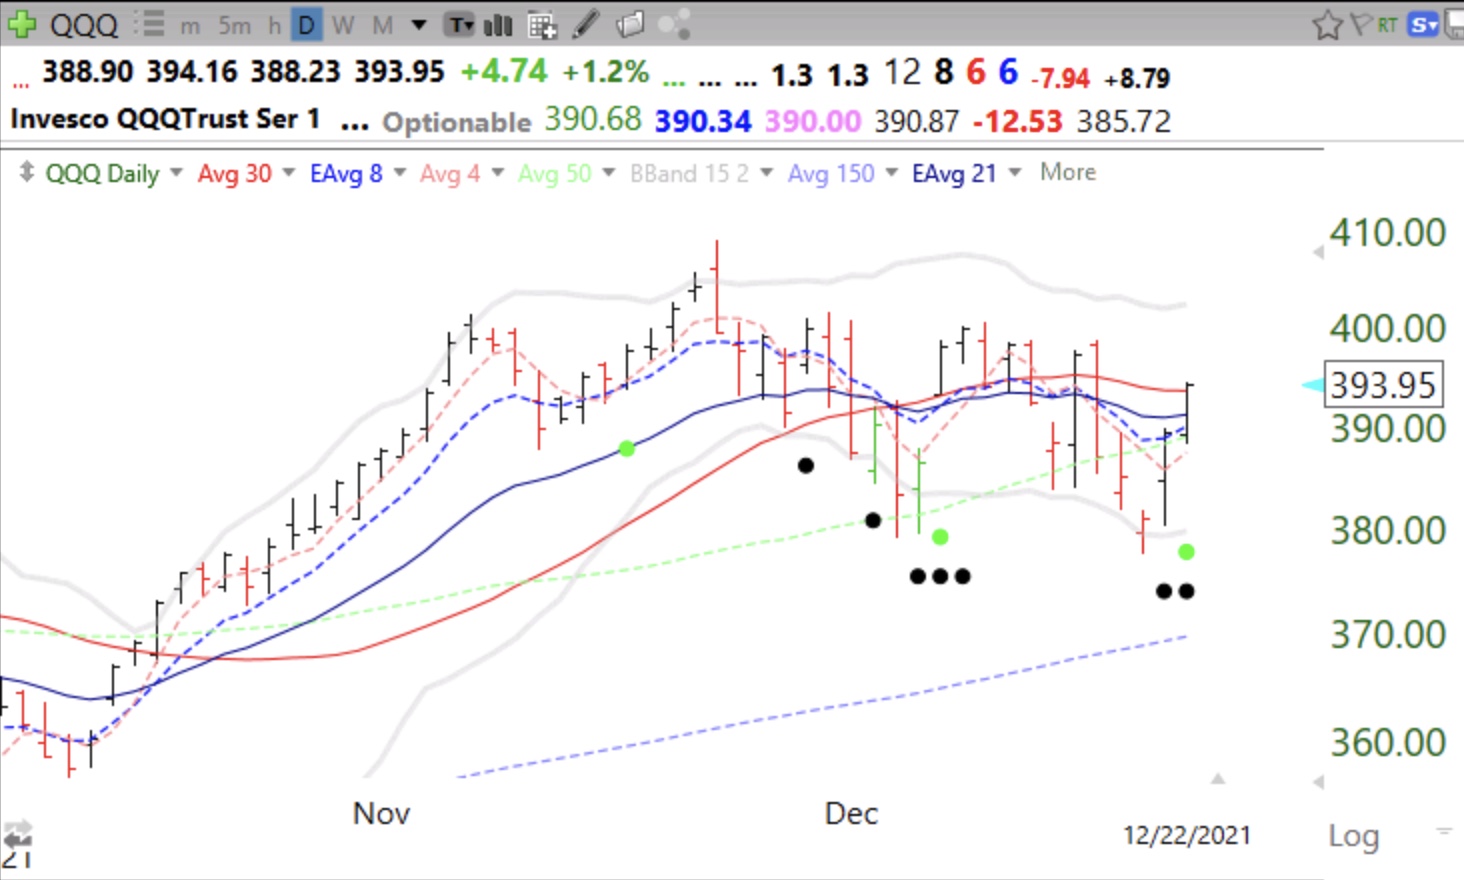
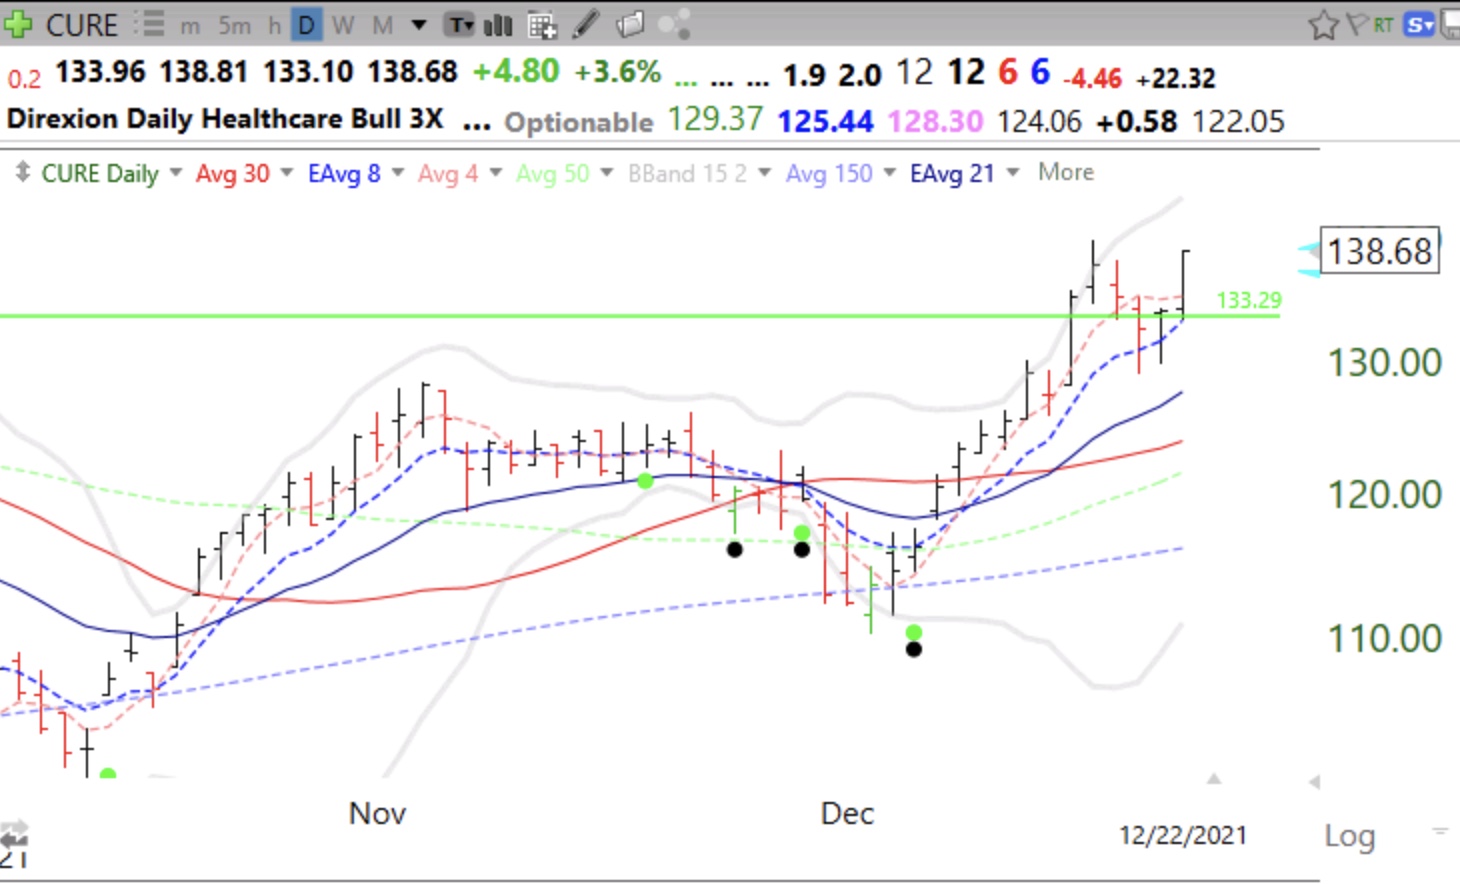
Blog post: Day 7 of $QQQ short term down-trend but could end on Thursday; $QQQ has green and black dot over sold bounce signals, and $CURE retakes green line, see daily charts
4 thoughts on “Blog post: Day 7 of $QQQ short term down-trend but could end on Thursday; $QQQ has green and black dot over sold bounce signals, and $CURE retakes green line, see daily charts”
GMI has been less than 3 since December 19. Doesn’t that indicate a “Red Signal”? I thought a GMI of less than 3 for two or more days triggers a red.
Loading...
Link to what Green / Black Dots represent, please?
Loading...
Doug – see post in this blog for July 12, 2021 where Dr. Wish defines black and green dots. I tried including a link, but I think that post was blocked.
Loading...
Thank you, rwjr. I’ve been trying to scroll through the prior blog posts to get definitions/descriptions of all of the major terms / signals and am having no luck since there are so many posts and no real way to search them 🙁
I appreciate your sharing of the date for at least one of them!
GMI has been less than 3 since December 19. Doesn’t that indicate a “Red Signal”? I thought a GMI of less than 3 for two or more days triggers a red.
Link to what Green / Black Dots represent, please?
Doug – see post in this blog for July 12, 2021 where Dr. Wish defines black and green dots. I tried including a link, but I think that post was blocked.
Thank you, rwjr. I’ve been trying to scroll through the prior blog posts to get definitions/descriptions of all of the major terms / signals and am having no luck since there are so many posts and no real way to search them 🙁
I appreciate your sharing of the date for at least one of them!