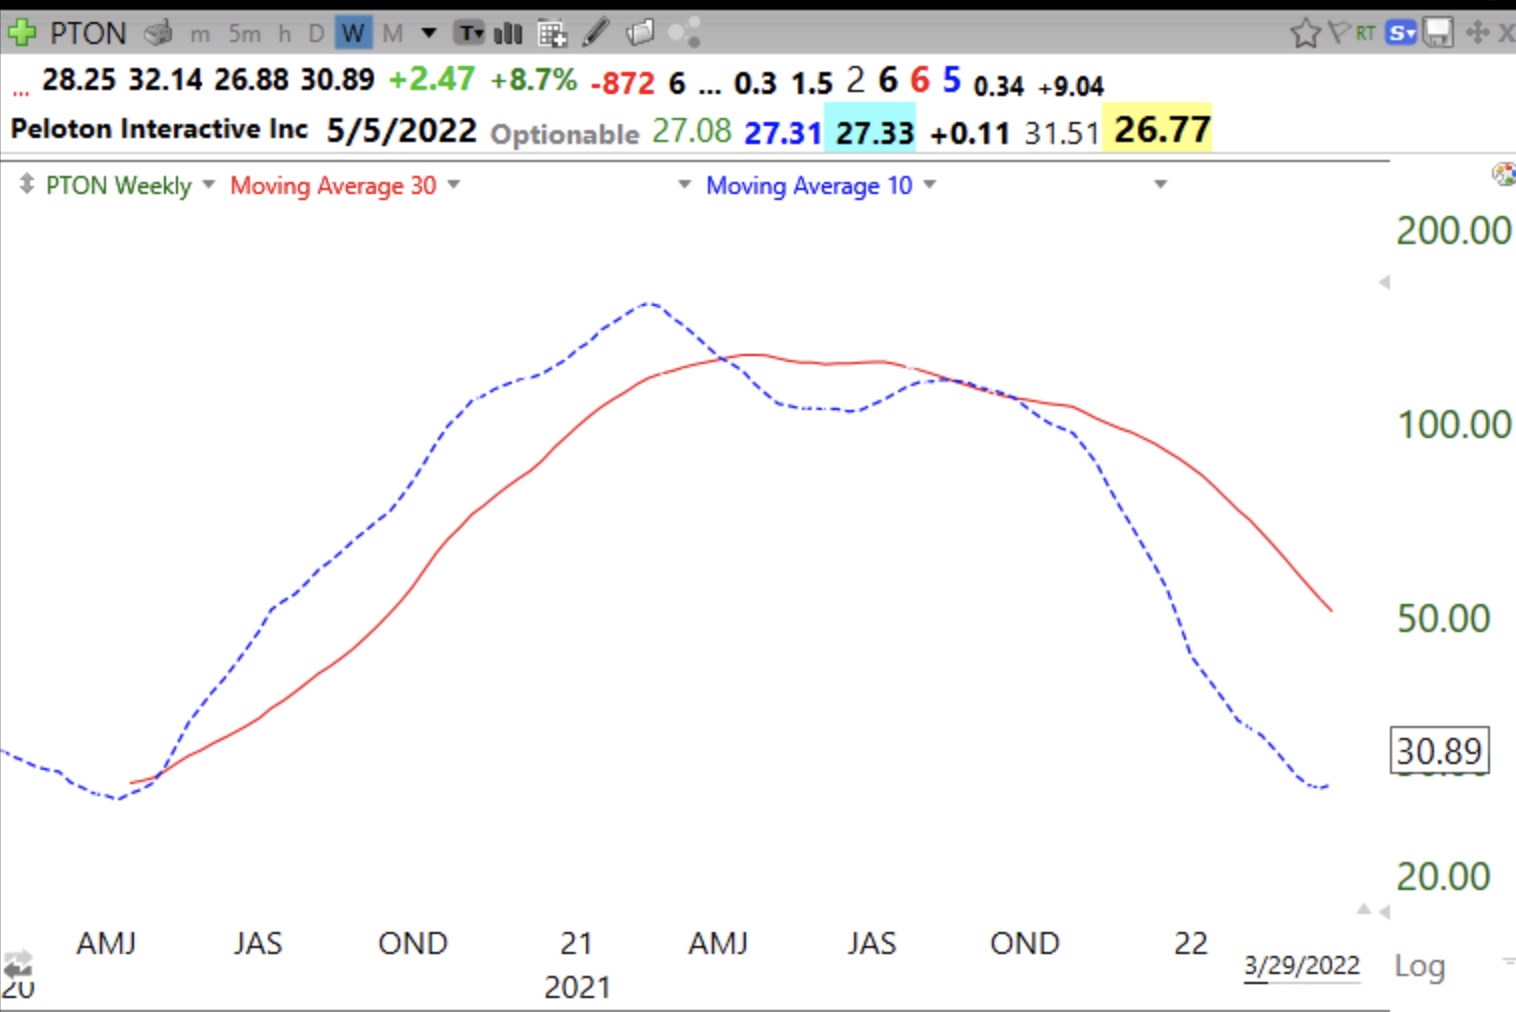
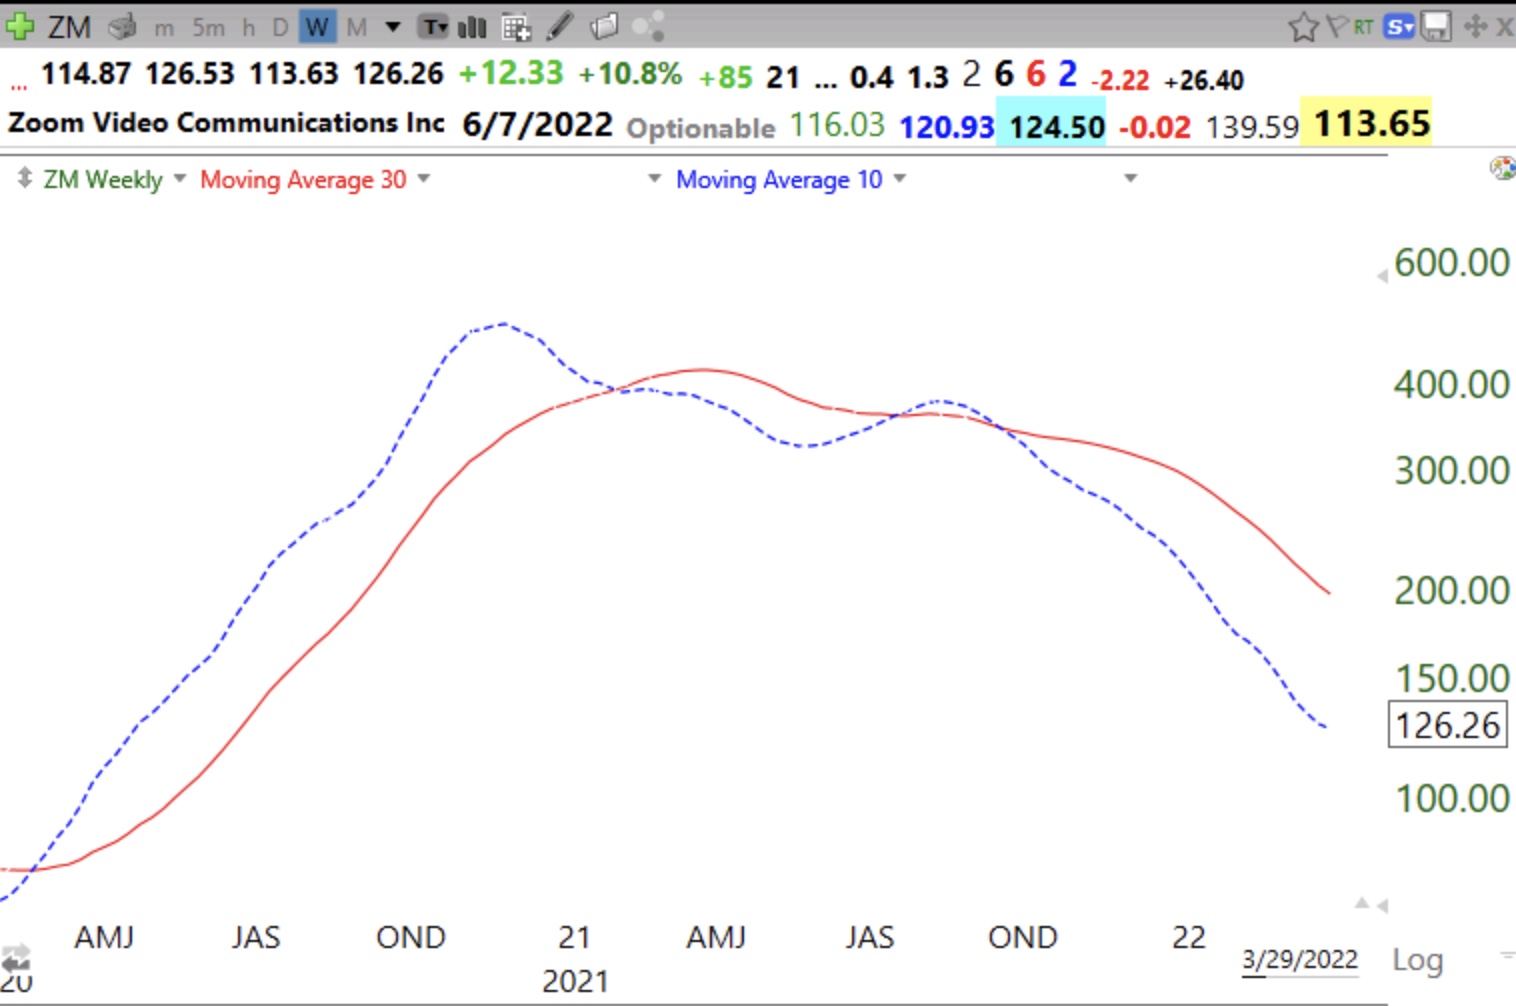
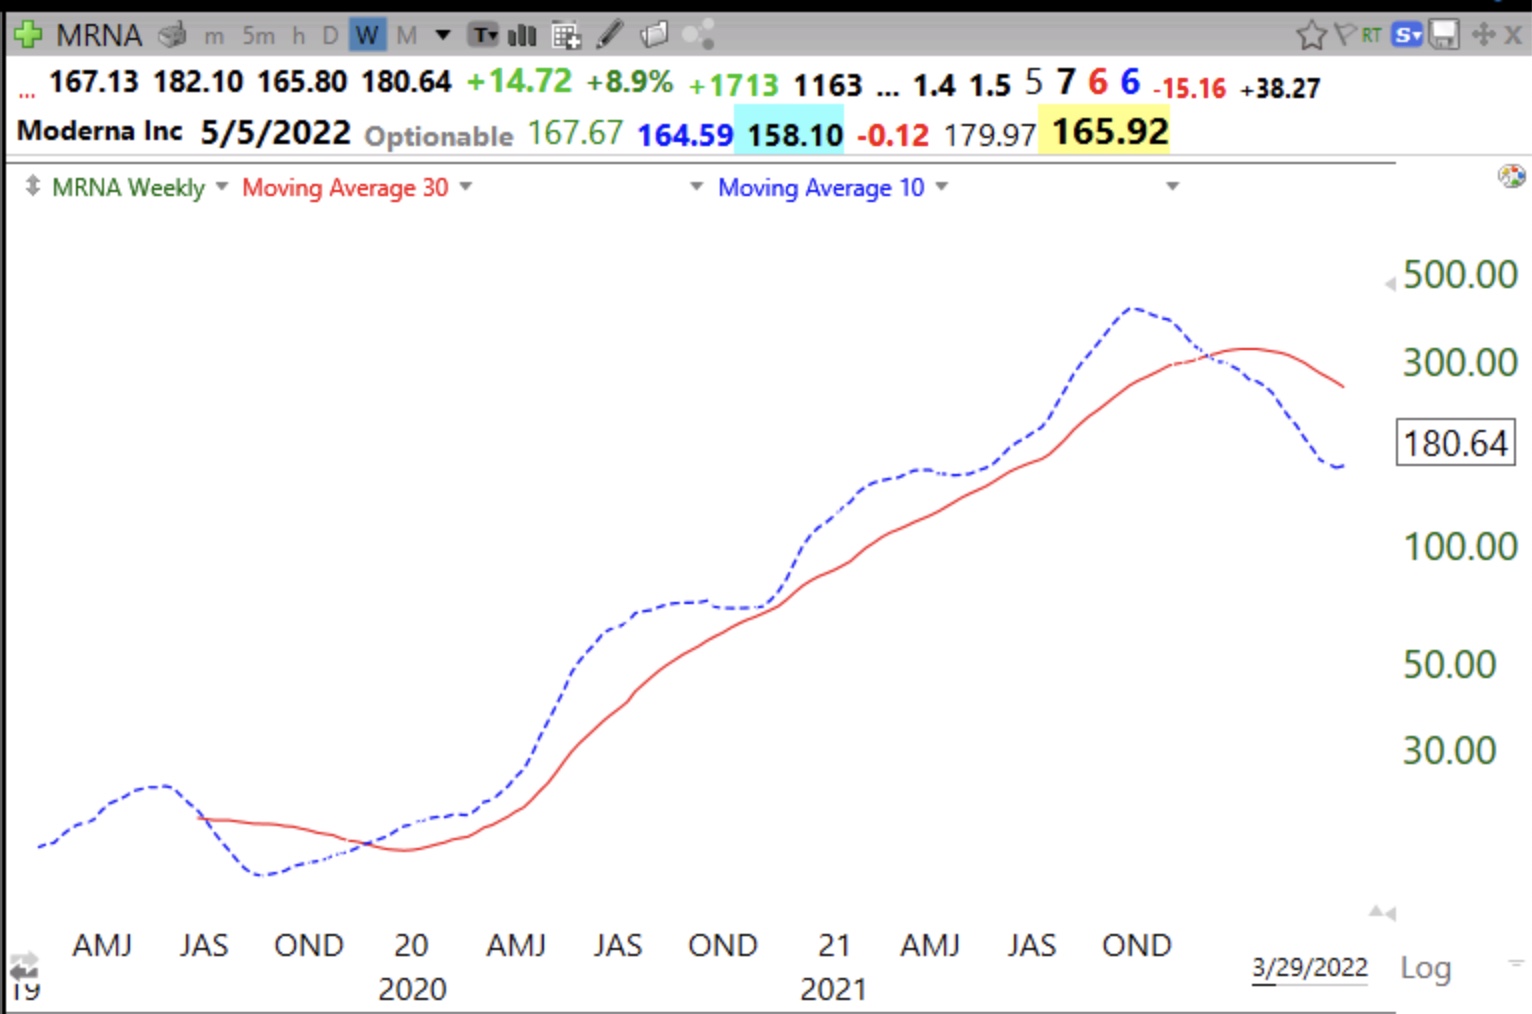
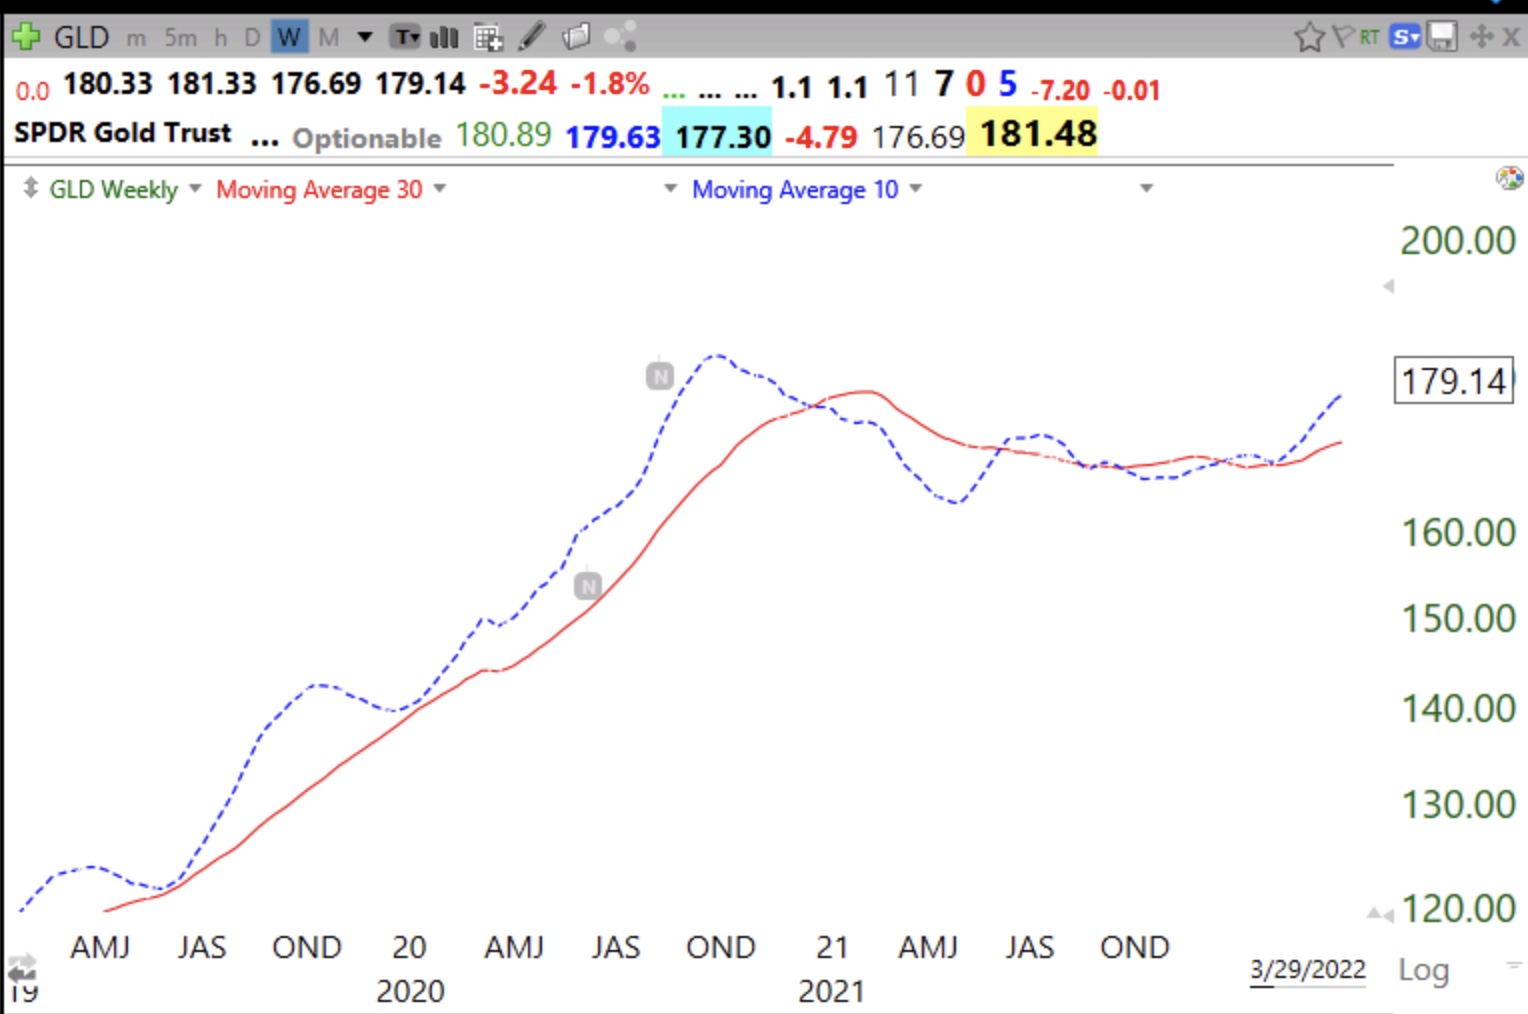
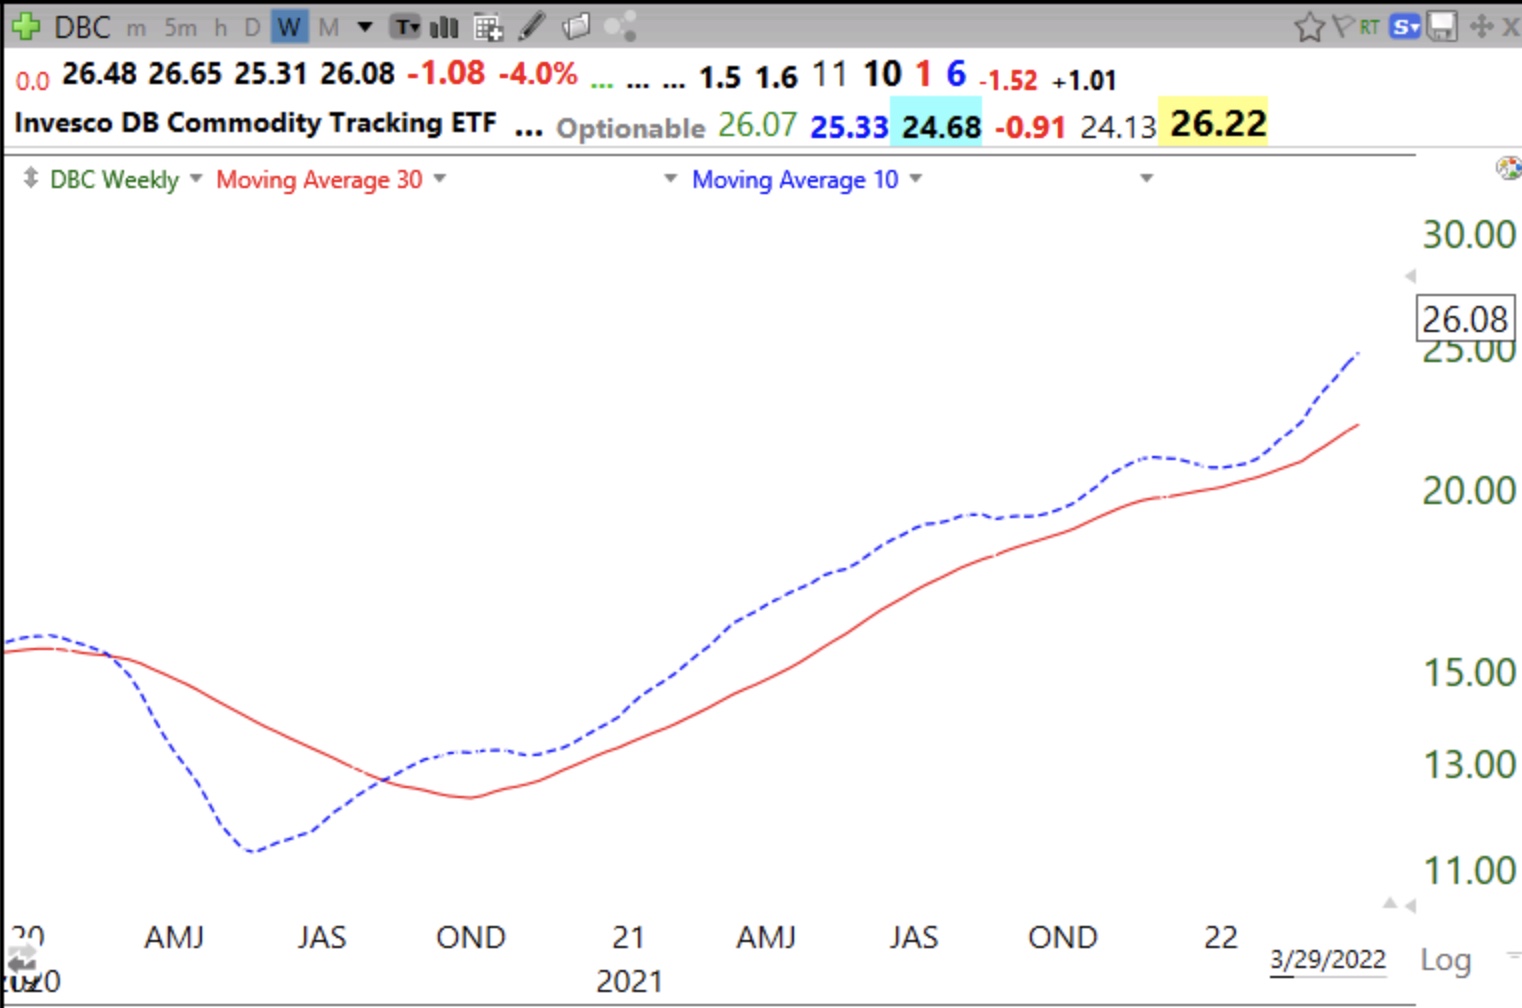
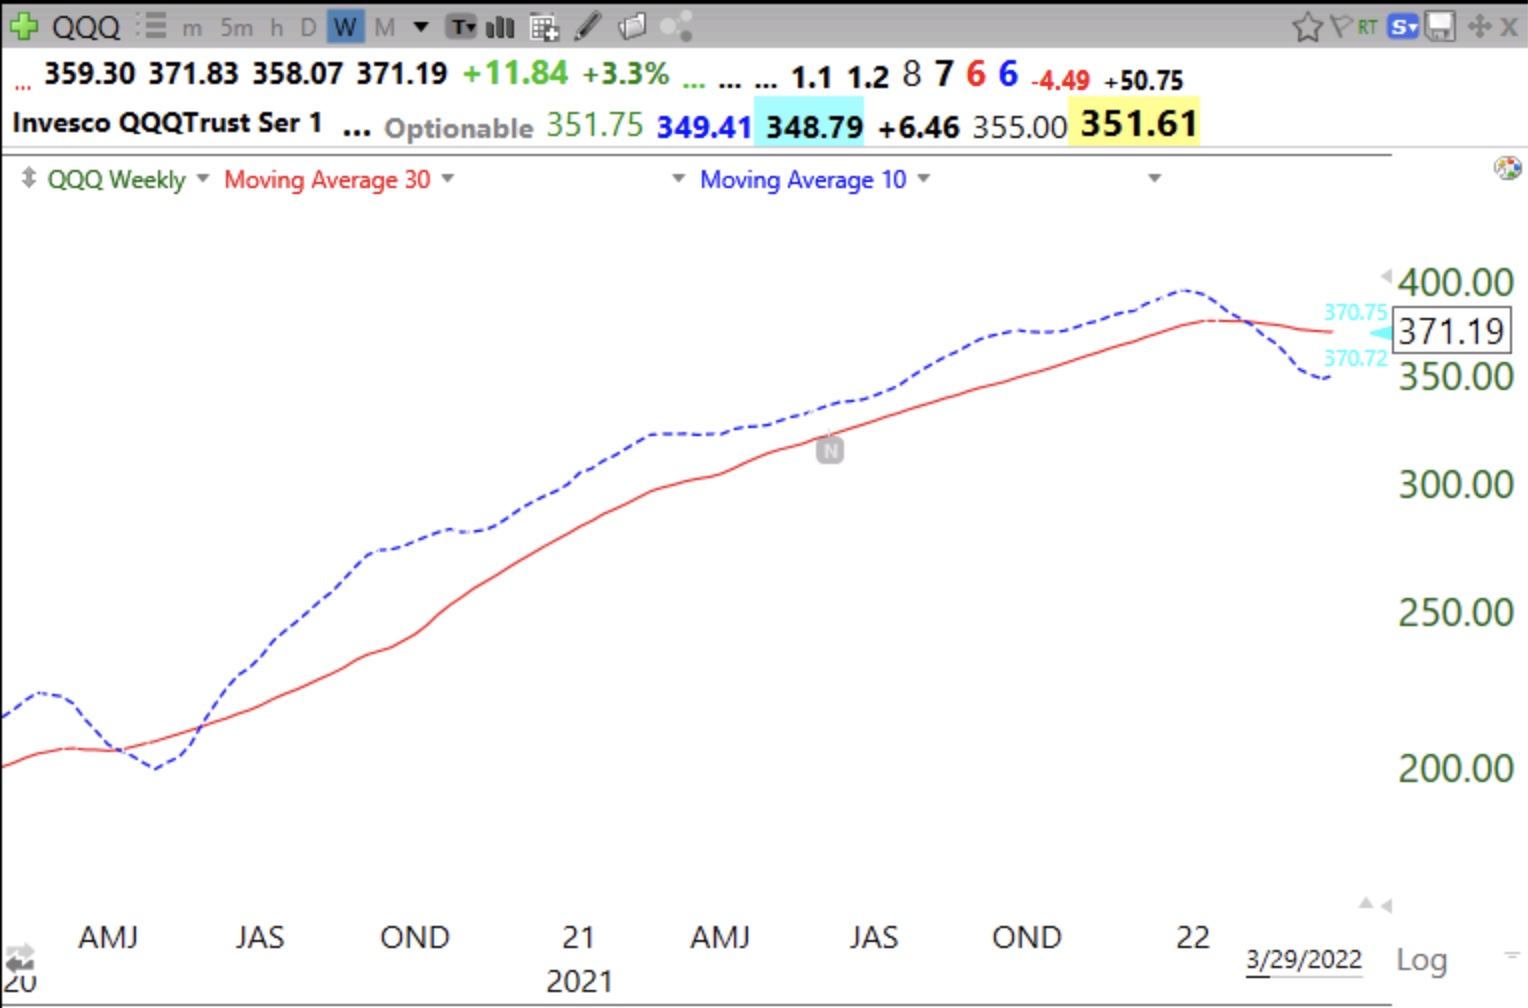
A strong up-trend is characterized by the 10 week average rising consistently above the 30 week average. This chart shows just these 2 averages without the price bars (naked). Compare the 2020 bottom with the recent pattern. We are not there yet. To be in an up-trend the 10 week average needs to rise above the rising 30 week average. Look how well one would have done to have owned QQQ only when the 10 week average was above the 30 week. See below some examples of how this strategy applies to stocks, indexes and commodities. It is a great way to avoid being shaken out of a position by the daily volatility.
Look how it would have helped you trade PTON , ZM, MRNA, GLD, DBC.