Worden’s T2108 indicator is the percentage of NYSE stocks that have closed above their simple 40 day moving averages. T2108 is available in TC2000 and I list its value every time I post. I consider T2108 to be a pendulum of the market. I tell my students when T2108 falls to single digits they should back up the truck and buy a little SPY, not individual stocks. The market, SPY, will come back, but not all stocks will recover. Then they should buy more SPY only as it moves higher.
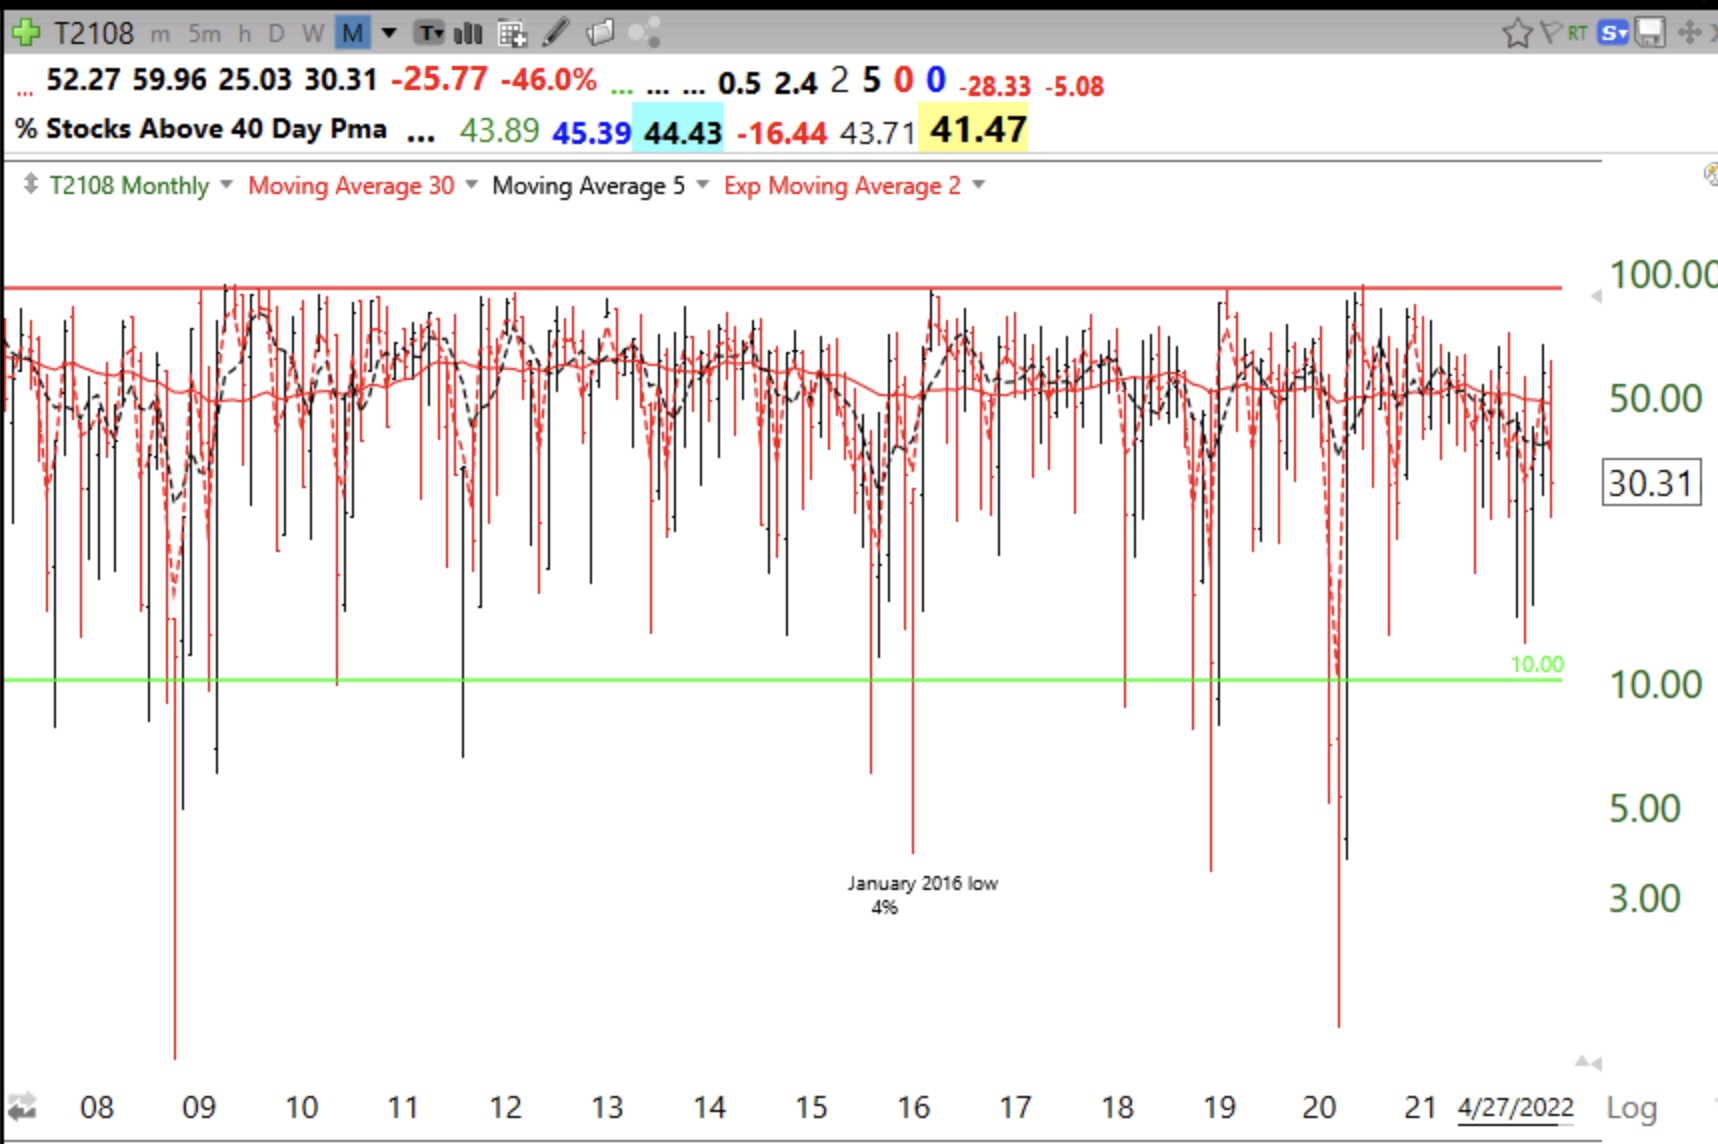
I am always afraid to take my own advice because when T2108 falls that low the financial news is horrible and everyone is scared. Now that I am in cash, I hope to take a deep breath, hold my nose and buy some SPY the next time it declines below 10. As this monthly chart shows, T2108 at 30% is far above the level it reaches when major declines have ended. So watch out below….
SHOULD I BE SELLING OUT OF THIS MARKET? FIVE STOCKS: CSCO INTC HD XOM BP? I NEVER THOUGHT YOU COULD BE SO RIGHT. IT TOOK A LITTLE WHILE.