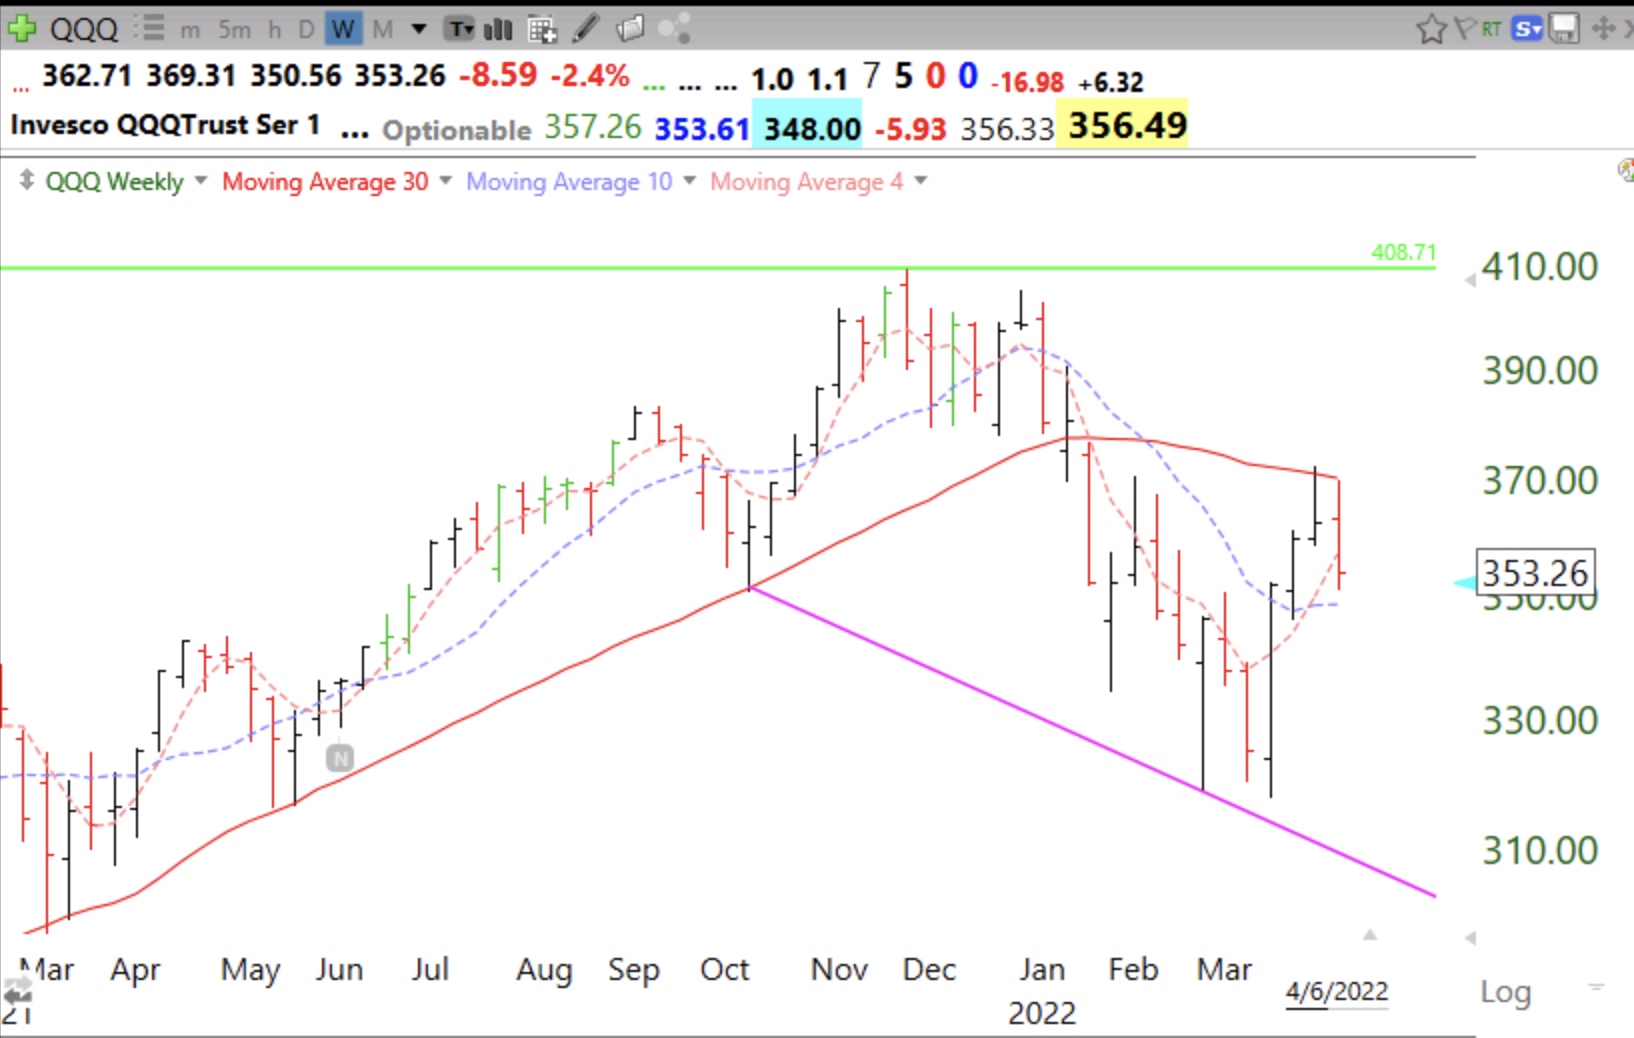
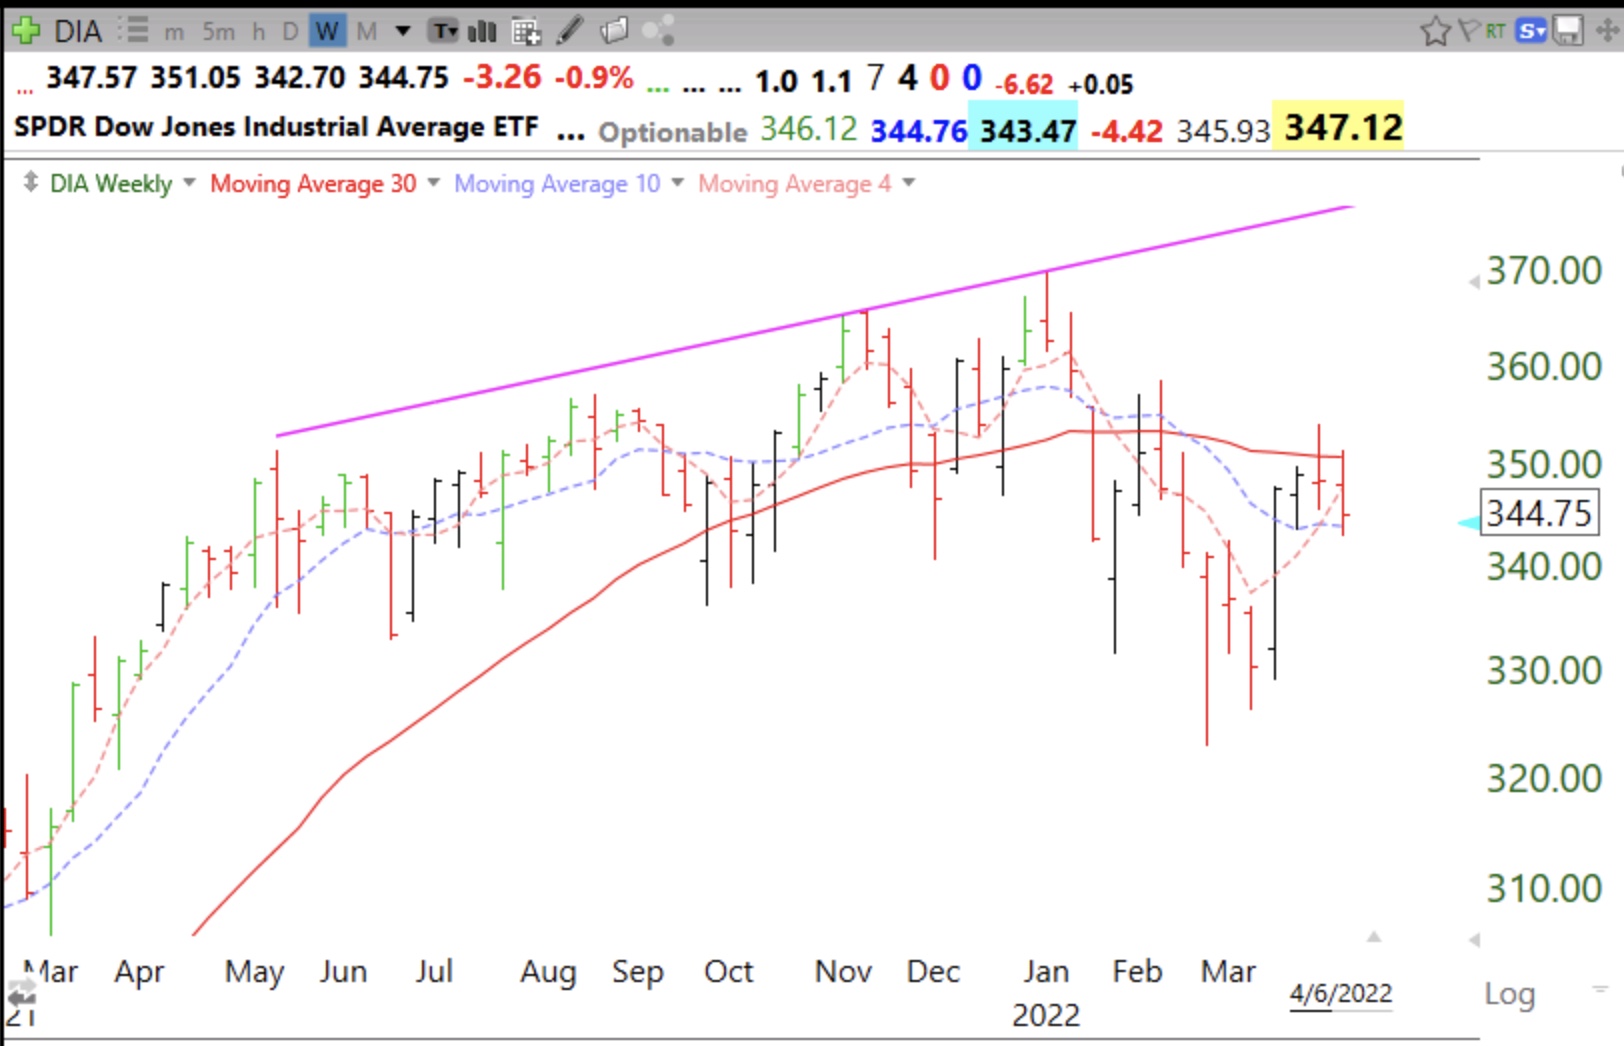
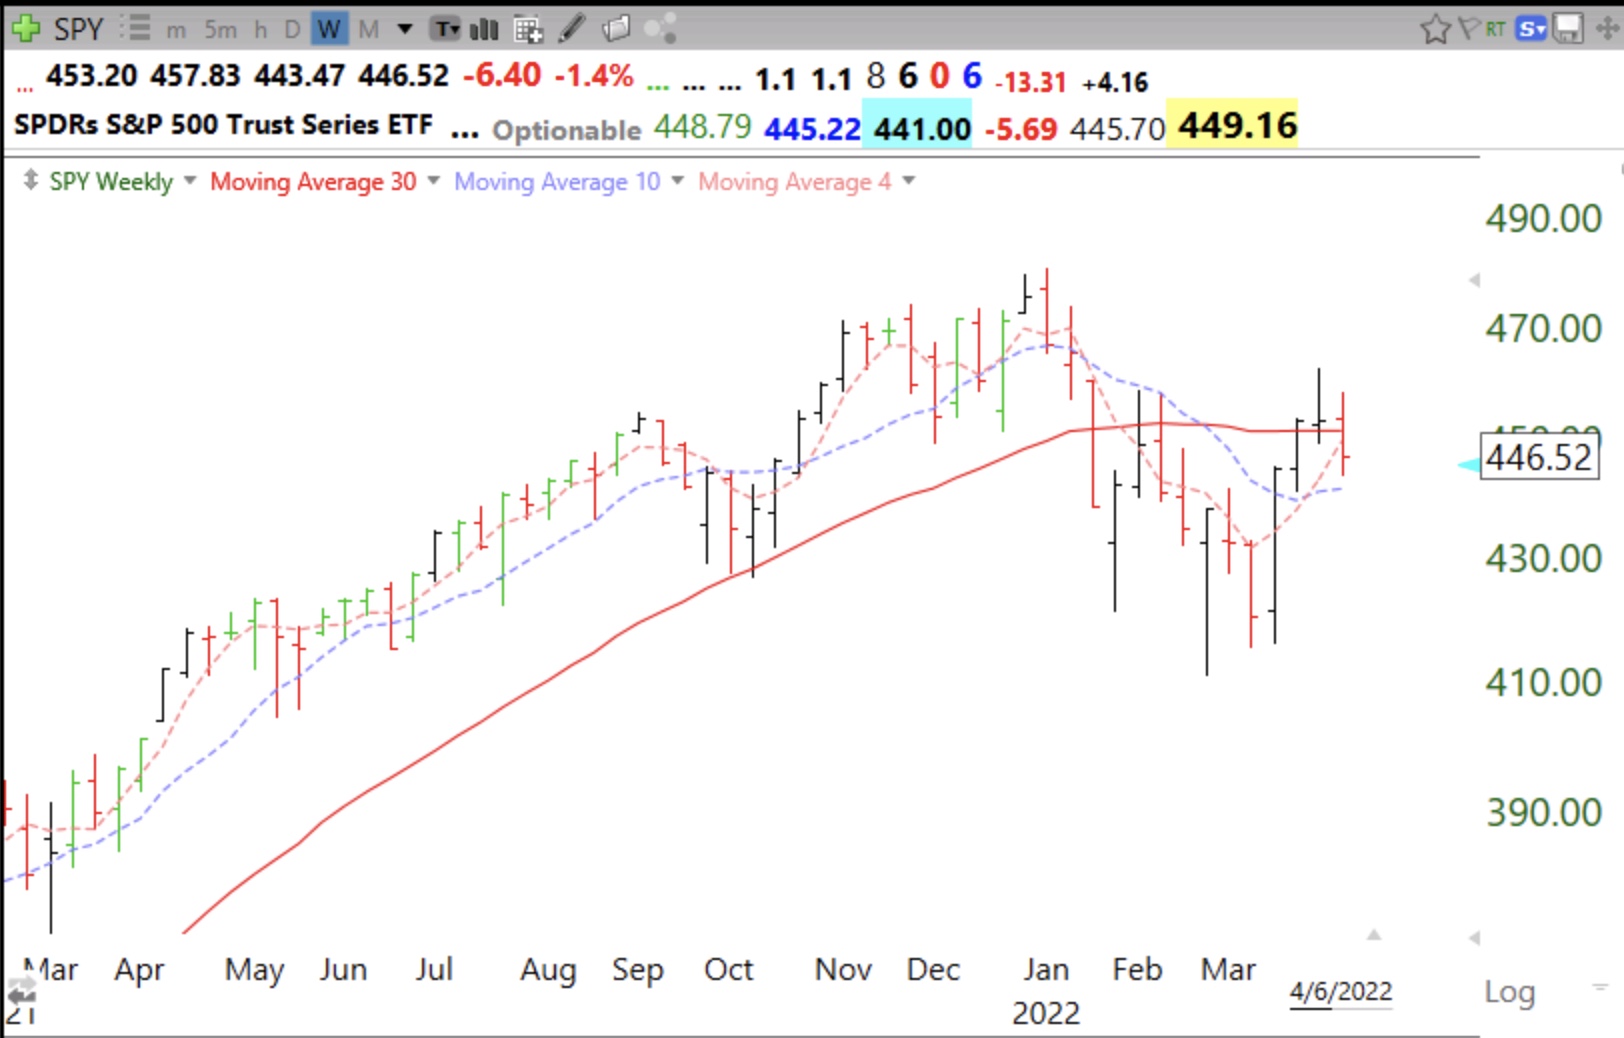
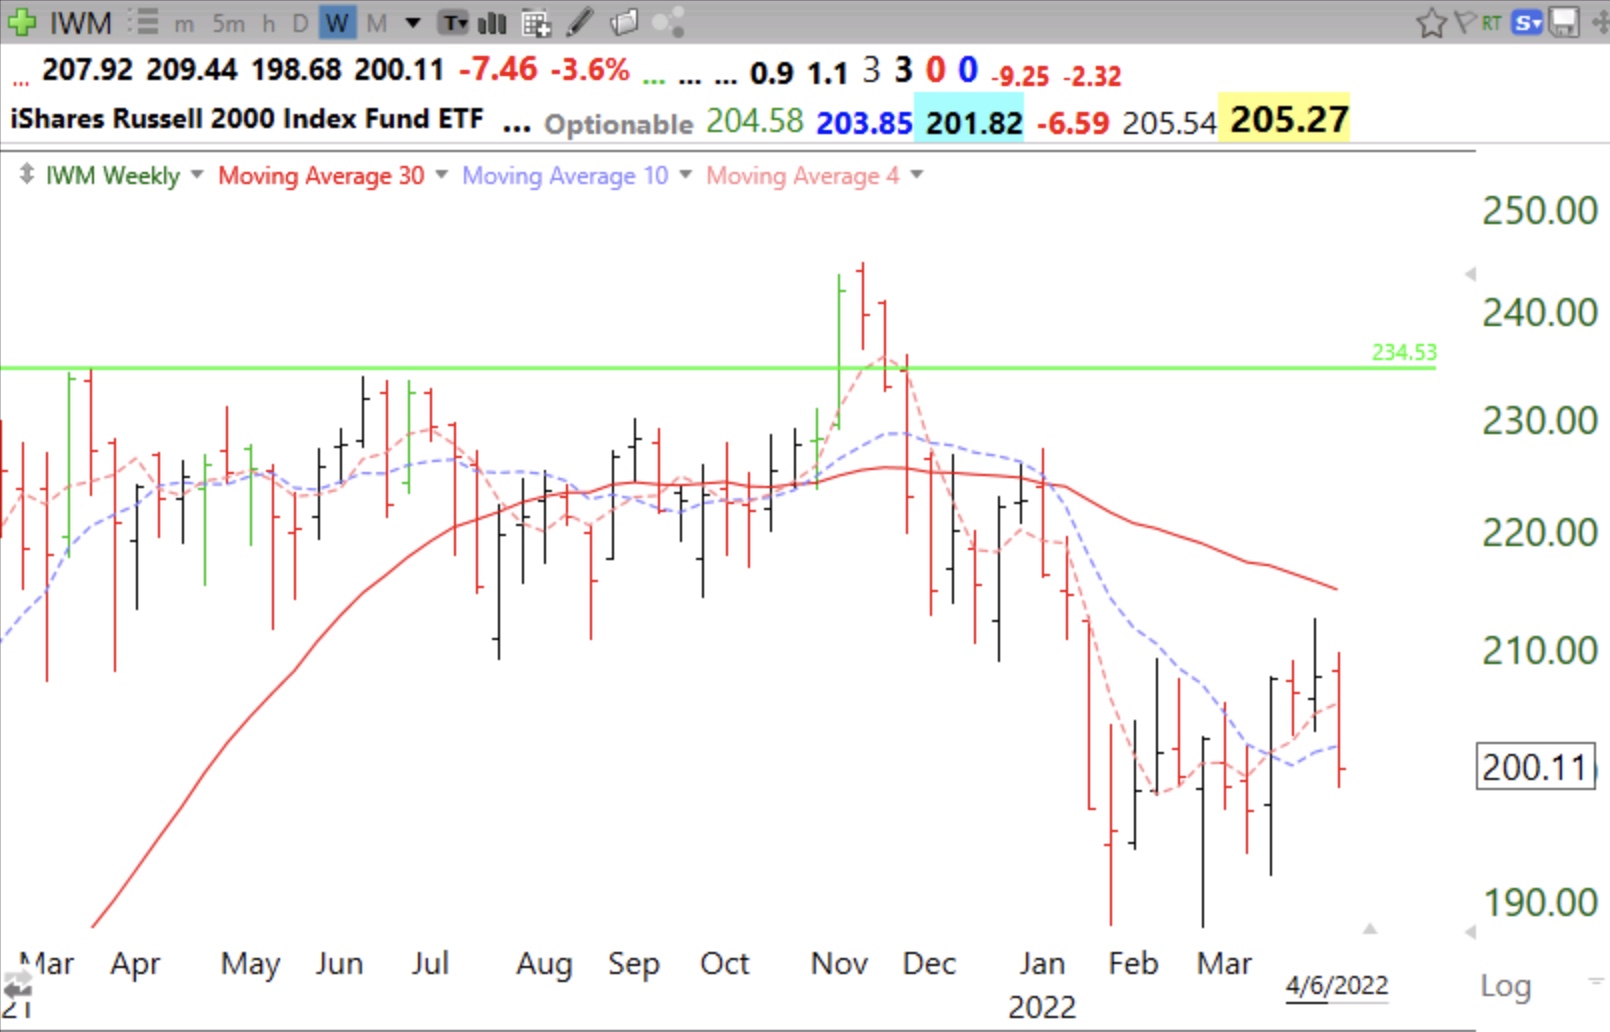
In the past when I took more chances I would wait for the 30 week average to curve down before taking my conservative university pension money out of the market. We have reached that point now with QQQ, DIA, IWM, and maybe SPY. However, as I wrote last November, I began to transfer my university pension money out then because of the technical weakness I saw in the market. I described my reasons for exiting the market last November in the Eastern Michigan AAII webinar I presented last January, that you may access on the Webinars tab on this blog.
The purpose of this blog is to share with people what I have learned from the markets the past 50+ years. In my opinion, a major decline is just beginning. While younger persons can wait out this cycle, I will not. It is much better for me to be in cash until the major trends turn up. Remember, after the 1929 debacle, it took 26 years for the DOW to come back to its pre-crash level. A lot of people made money trading in 2021 when the market averages repeatedly hit new all-time highs. That is when fortunes can be made. That is now over. I will reenter when the 30 week averages start rising again.
As the greatest trader, Jesse Livermore said:
“Finally there came the awful day of reckoning for the bulls and the optimists and the wishful thinkers and those vast hordes that, dreading the pain of a small loss at the beginning, were now about to suffer total amputation—without anesthetics.”
I have heard media pundits warn that once one gets out of the market no one rings a bell at the bottom to get back in–hogwash! If one exits something at $100 and it declines to $40, as long as you get back in before it climbs back to $100 you have come out ahead and with much less stress. See weekly charts for four index ETFs below. The solid red line is the critical 30 week moving average.