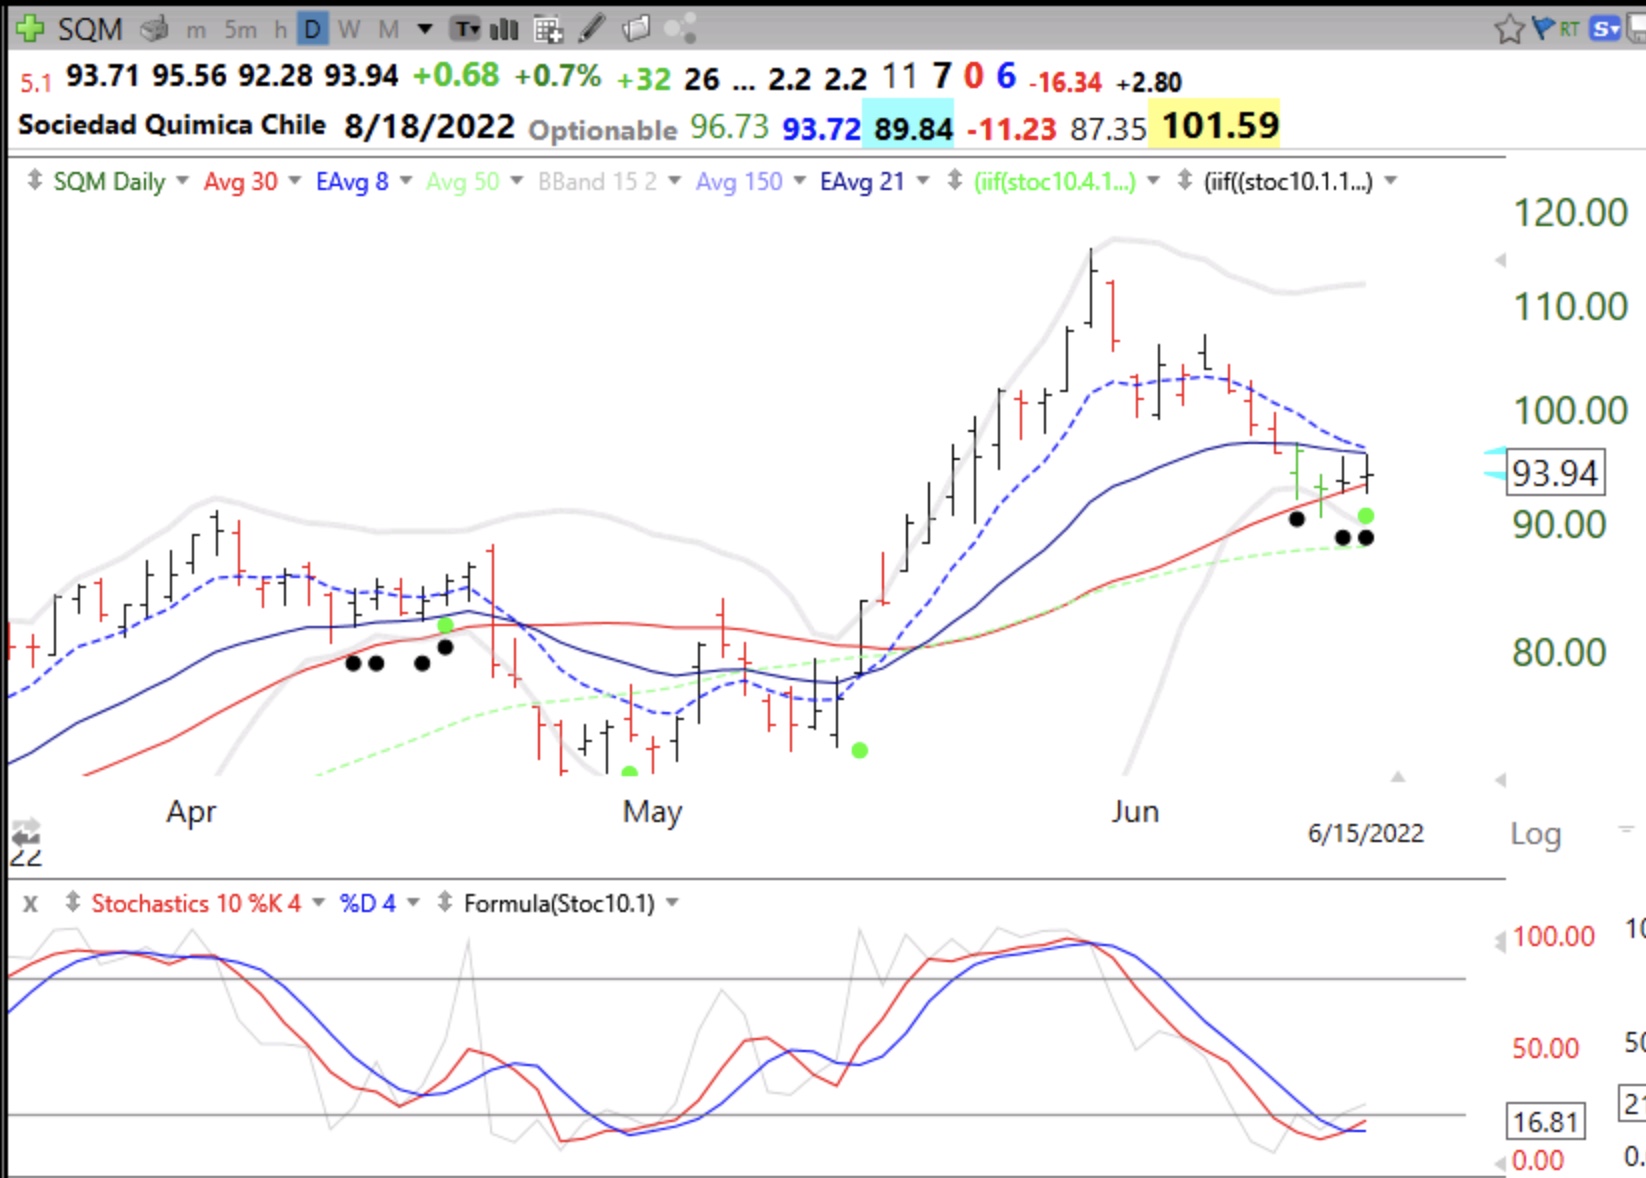
I scanned over 700 stocks on my IBD/MS watchlist and found only one that looks promising. This is one of my favorite set-ups. It scans for stocks that recently reached an all time high (ATH), then became oversold and now looks like it could bounce (OSB). The beauty of buying a strong stock that may be bouncing is that if the bounce fails it is immediately apparent and I can exit promptly with a small loss. My measure of oversold is based on the daily 10.1, 10.4 and 10.4.4 stochastics indicators. See if you can figure out the signals. These signals are designated by the black and green dots on this chart. In a weak market most set-ups fail, so it will be interesting to see if SQM works out. In a strong up-trending market this is a powerful set-up.
SQM has great fundamentals. MarketSmith indicates that this lithium producer is expected to grow earnings this year +353%, has a composite rating of 99 and ROE of 24%. Last quarter’s sales were up +282%. This is a CAN SLIM type stock. But can it climb in this market? Check out this chart. Note the prior oversold signals did not lead to a rise. I like the fact that SQM is just above its lower 2.15 Bollinger band and well below the upper band. A bounce could therefore extend to $111. My stop loss would be around $90.29. I do not own it. This is just an example for educational purposes only. You can find a tutorial created by my late co-instructor, David McCandlish, that shows how to add the dots to your chart here.