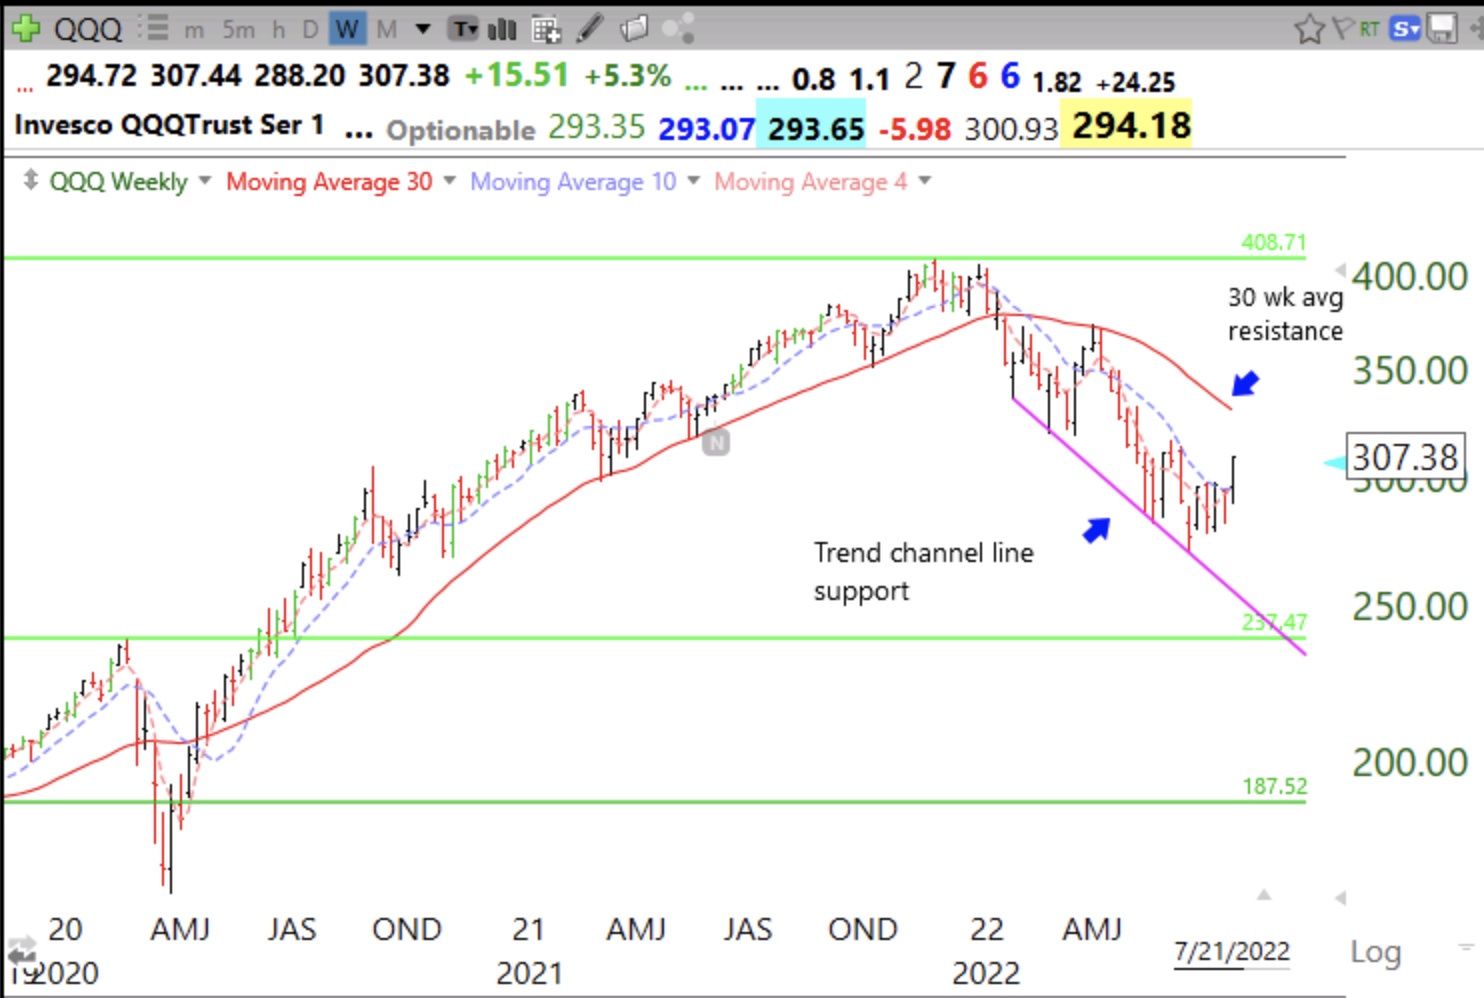
The place where QQQ has found support is at its trend channel line (red line). If this rally fails that is the likely next support which coincidentally is near where the last GLB in 2020 occurred. On the other hand, the place where this rally may stall out is at its 30 week moving average (red line curving down). We will just have to wait to see the outcome and be very nimble. I am slowly buying TQQQ to ride this short term up-trend. If it stalls I will exit immediately. QQQ is still in a stage 4 down-trend.
Are you just day trading TQQQ or holding it overnight?
After following your blog for quite a while, I can’t imagine why you’re buying in to a Stage 4 downtrend… is it possible you’re falling prey to the excitement of always having a bet down on the table? Instead of buying into a Stage 4 downtrend, why not wait for the expected stall in order to buy the “short fund” and trade in line with the major trend?