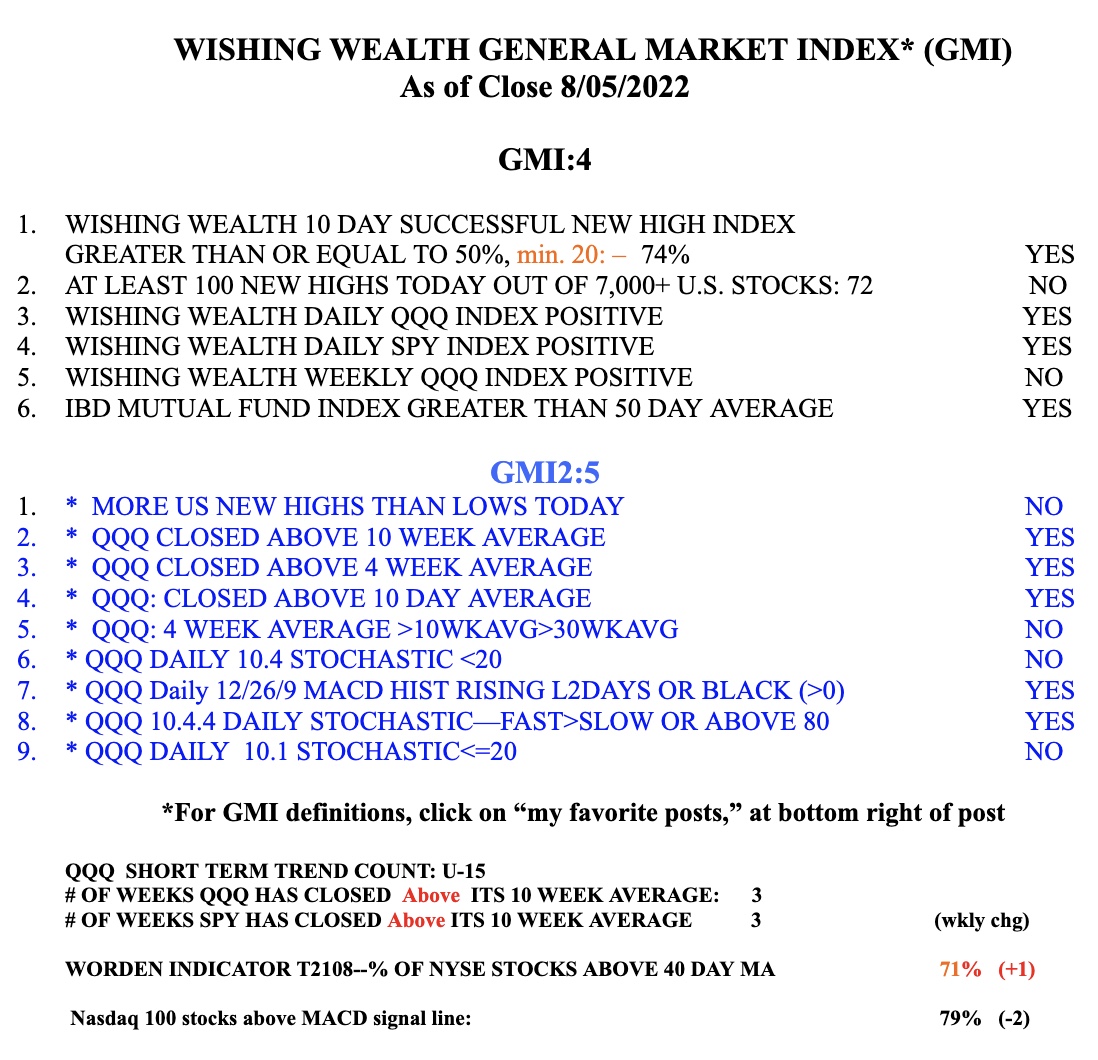
While the QQQ is in ints 15th day of a short term up-trend, I find it useful to look at how its adapted GMMA charts look. This consists of 12 exponential moving averages with different periods and a 13th average equal to 1 which shows the current price. In an up trend one wants to see the closing price (dotted line) leading all of the other averages higher. The 6 shorter averages are red and the 6 longer averages are blue. I draw it on a white background. When the red averages are rising above the blue leaving a white space between them I call it a RWB up-trend. The opposite is a BWR down-trend. These charts also reveal bases when all of the red lines come together, thus showing no price differences over the 6 shorter time periods.
This hourly chart shows that the QQQ is in an hourly RWB uptrend that is forming a small base with the red lines converging. I am watching for a move up or down out of the base this week.
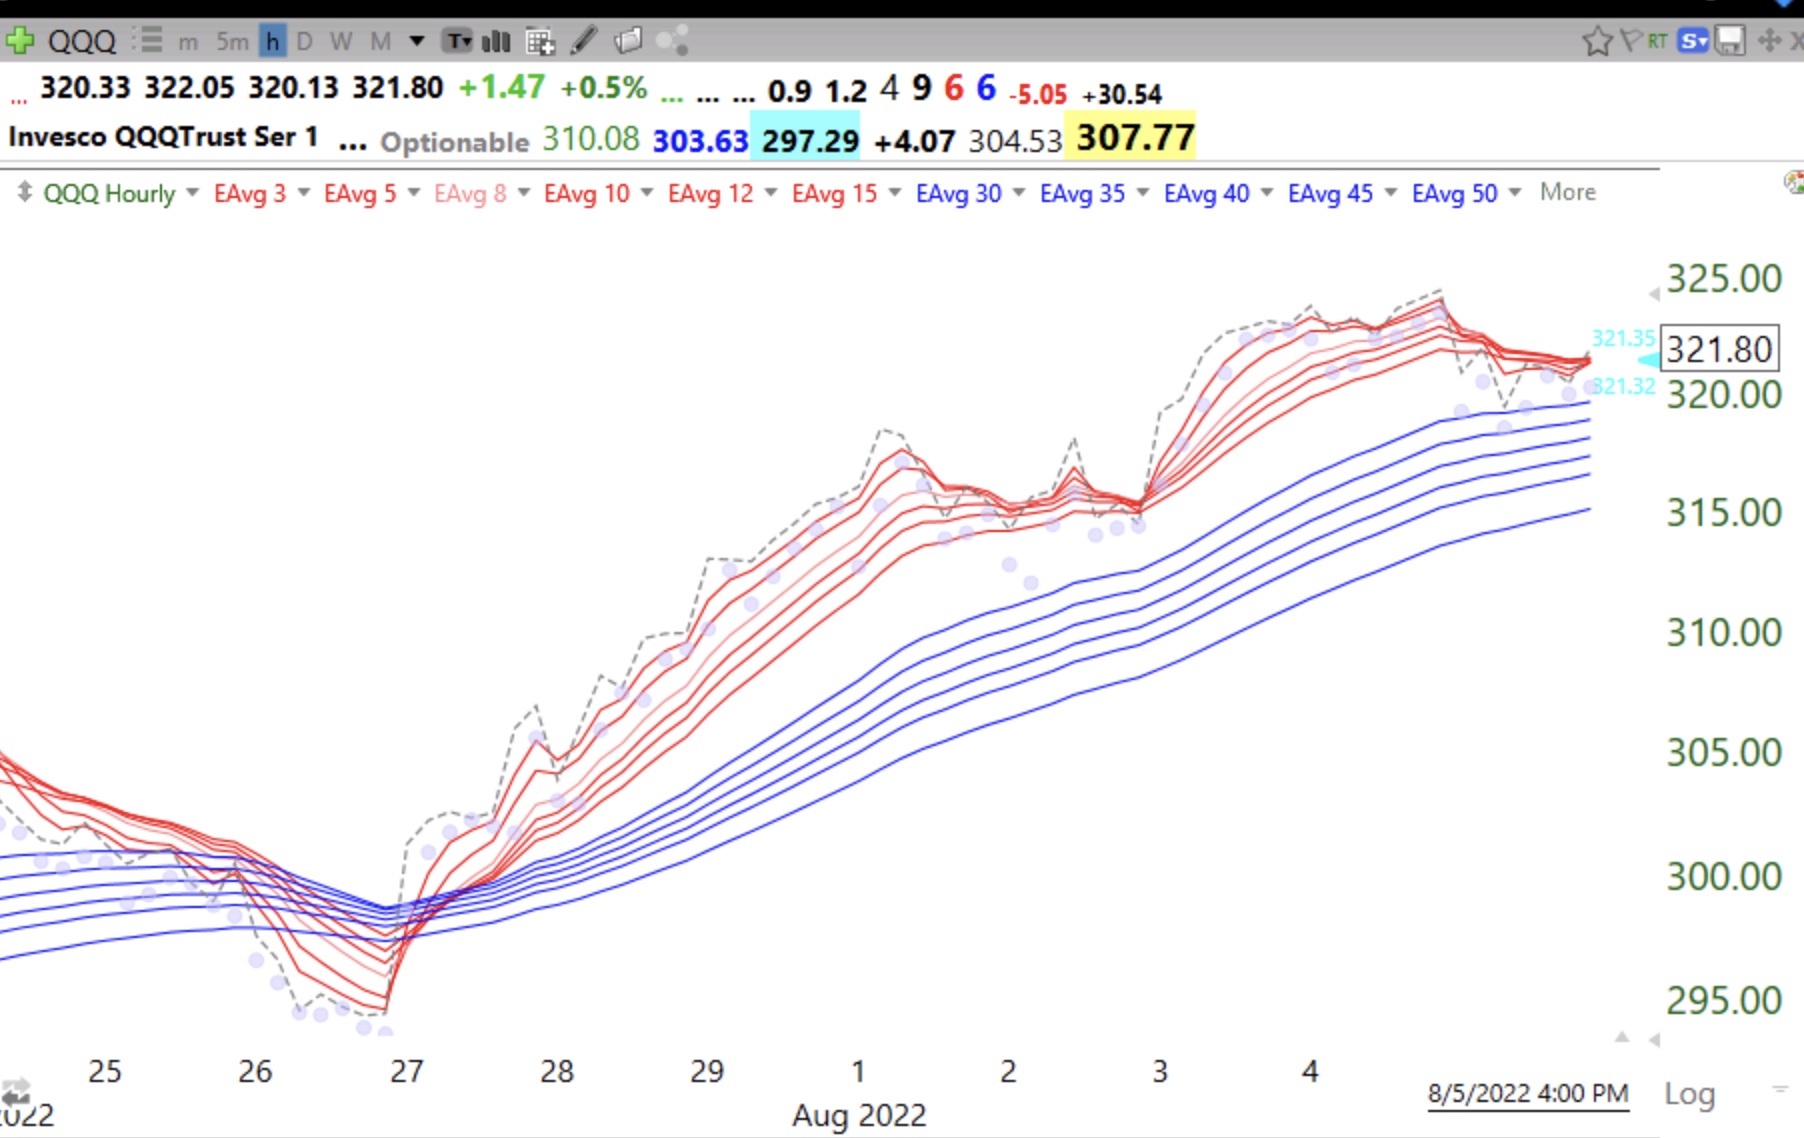
The daily chart also shows QQQ in an RWB up-trend. So QQQ is resting within a longer term daily up-trend. Will it fail as it did last April?
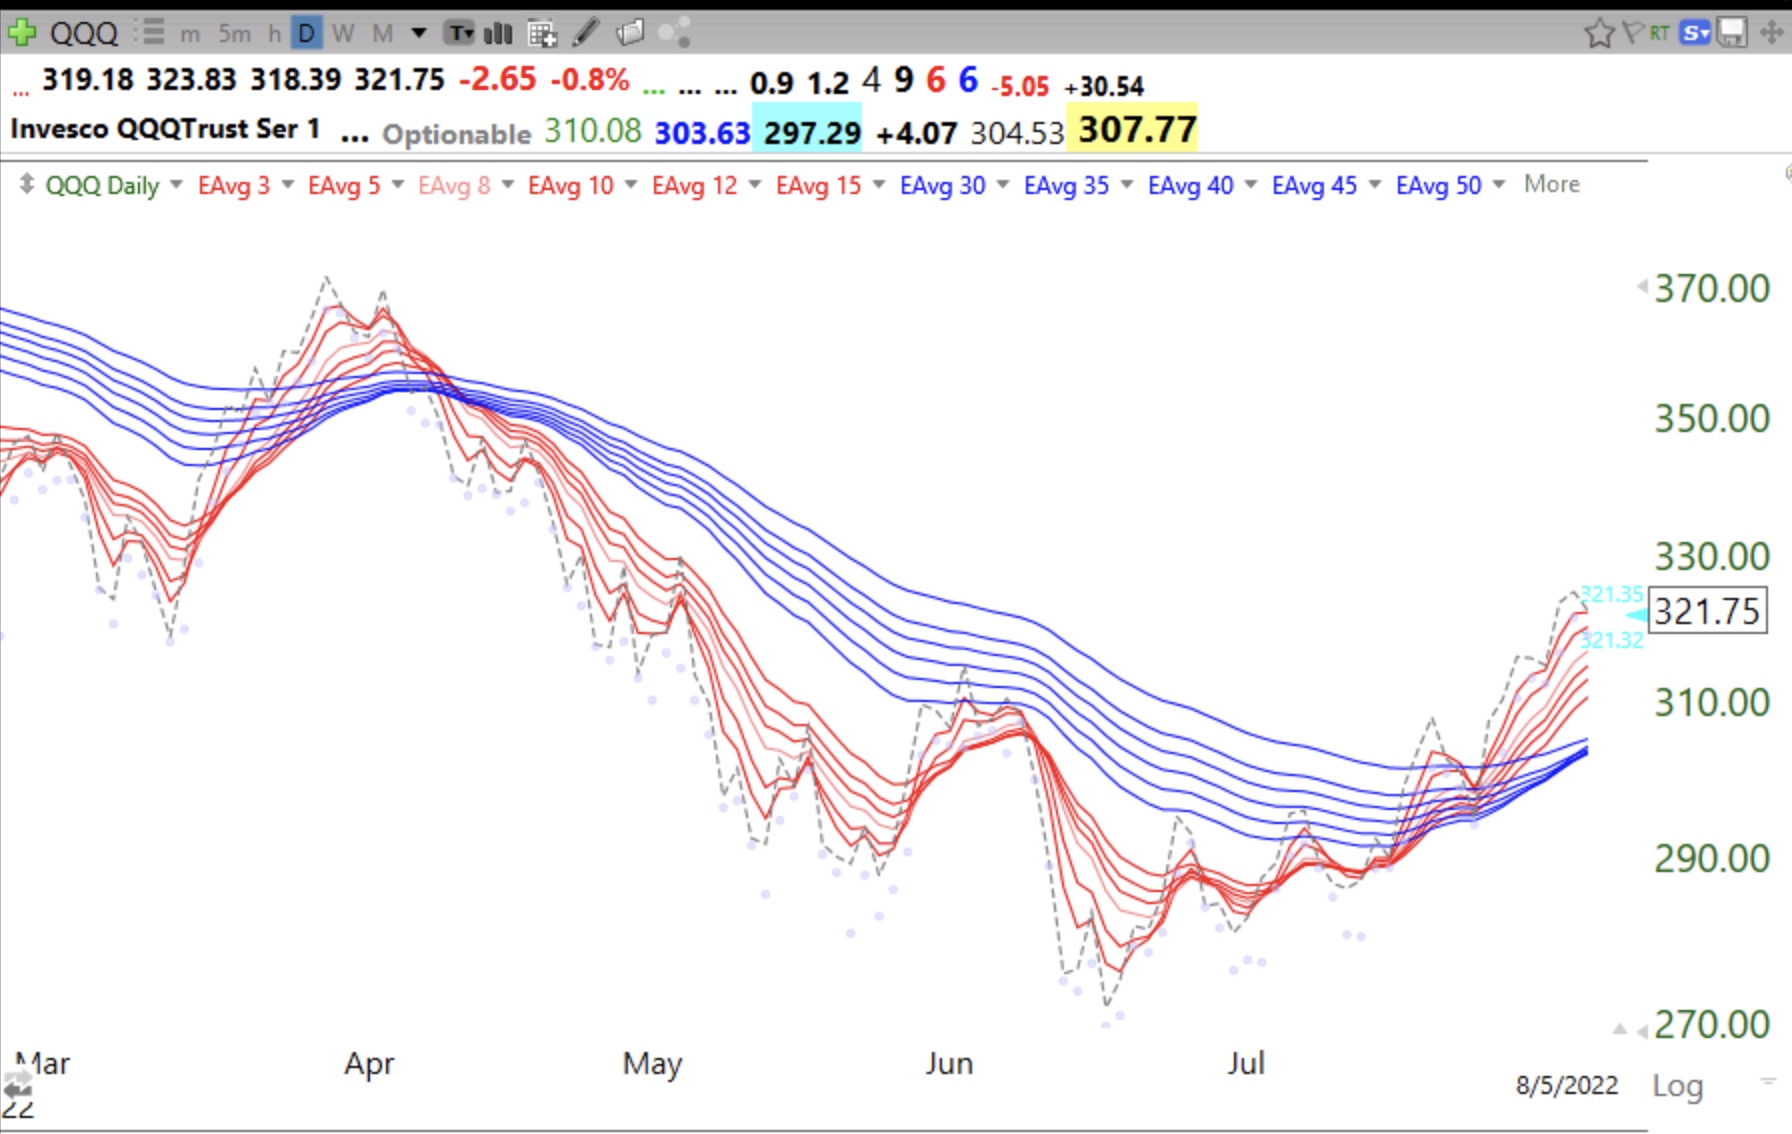
However, the weekly chart shows that QQQ remains in a longer term BWR down-trend. Note the strong weekly RWB up-tend in all of 2021. That is the type of market where people can make a lot of money. I will consider wading into the market in my conservative university retirement accounts when we get a new weekly RWB up trend. Such an up trend can last for months and give me considerable opportunity to profit. The time to exit from an up trend is when the white space disappears as it did at the end of 2021. GMMA charts are also useful for analyzing individual securities.
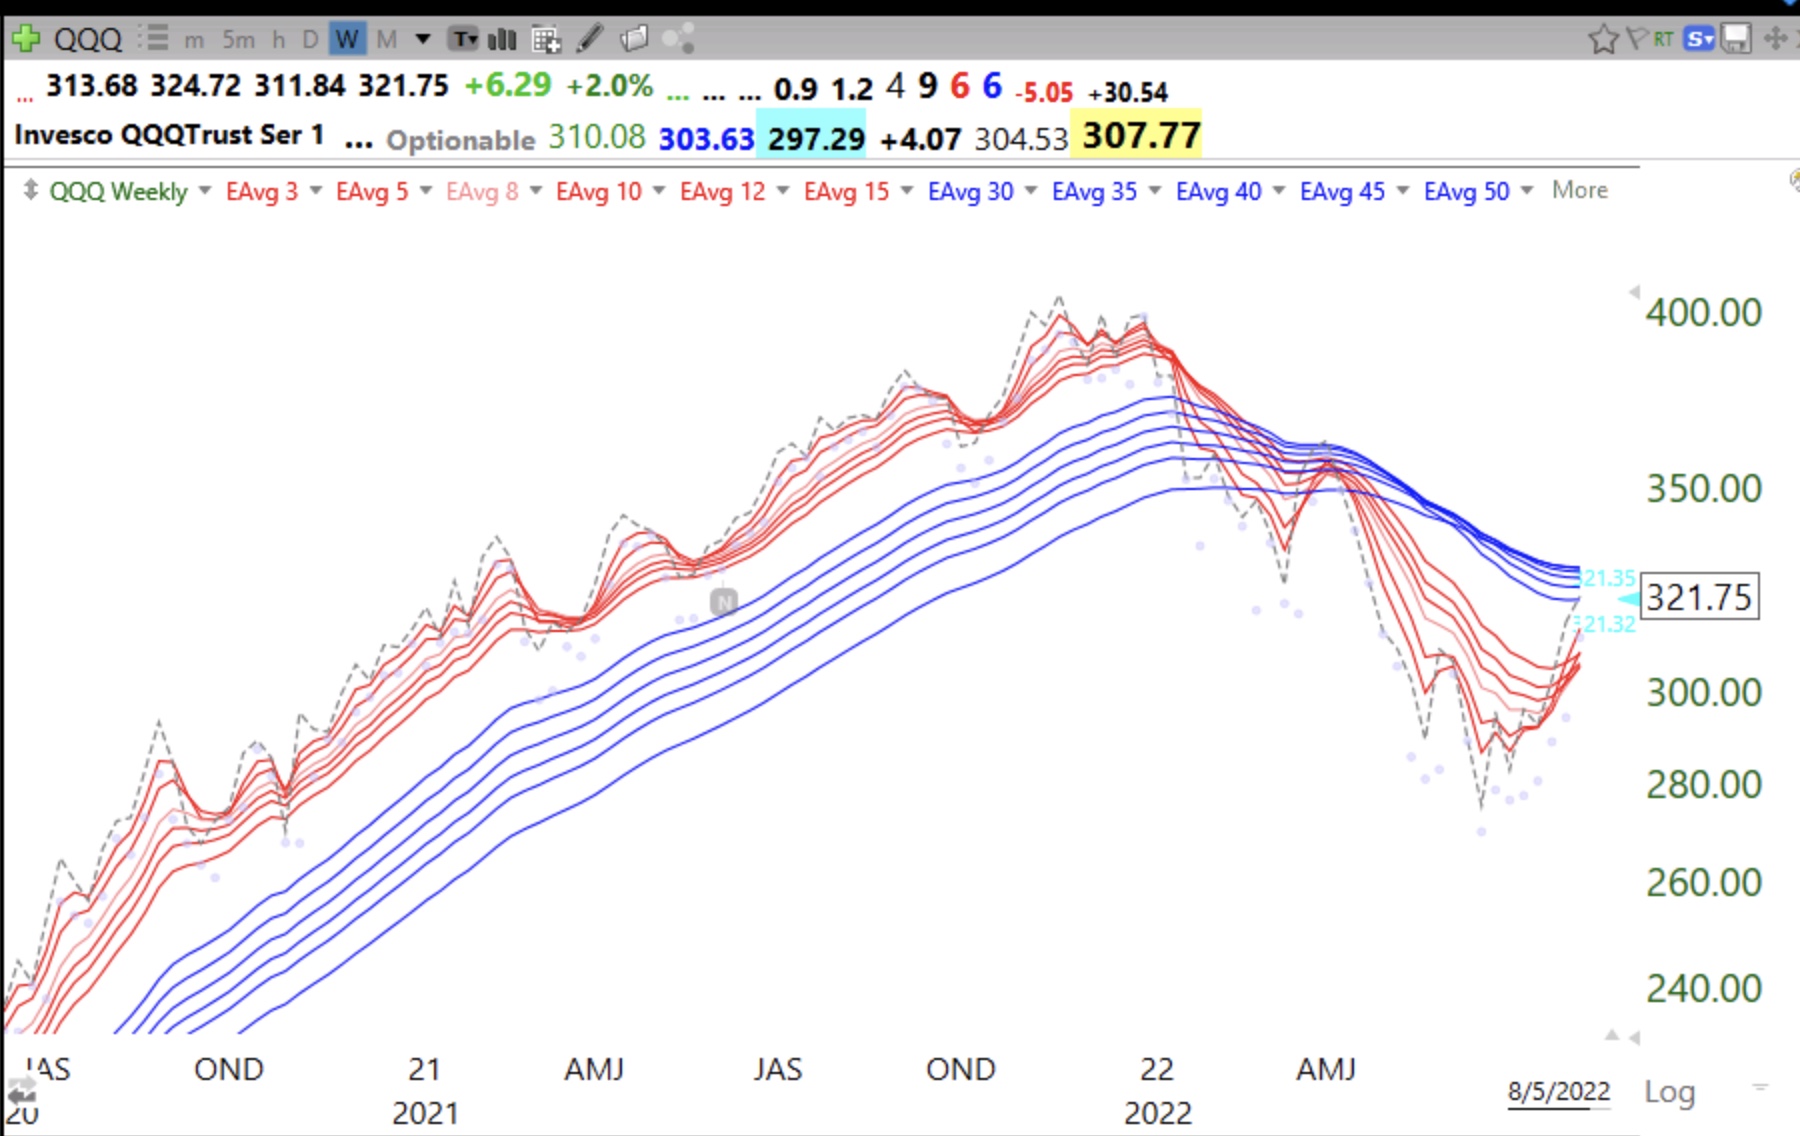
The GMI declined to 4 when QQQ closed back below its 30 week moving average on Friday. But it remains on a Green signal.