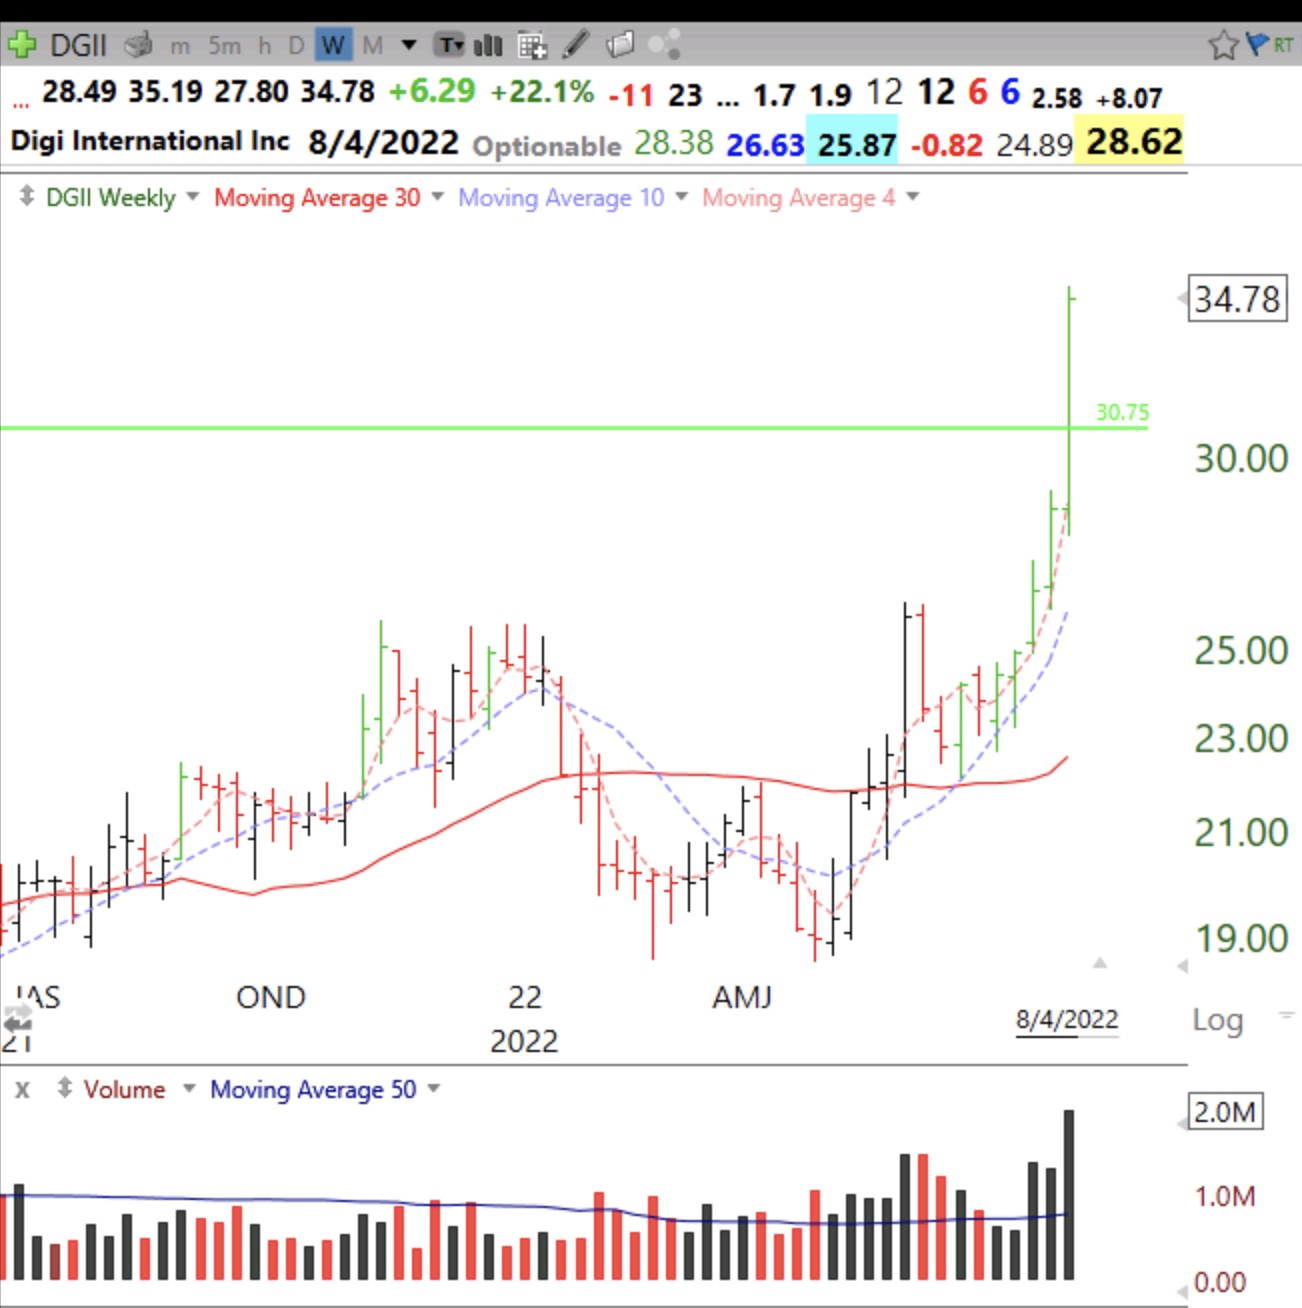
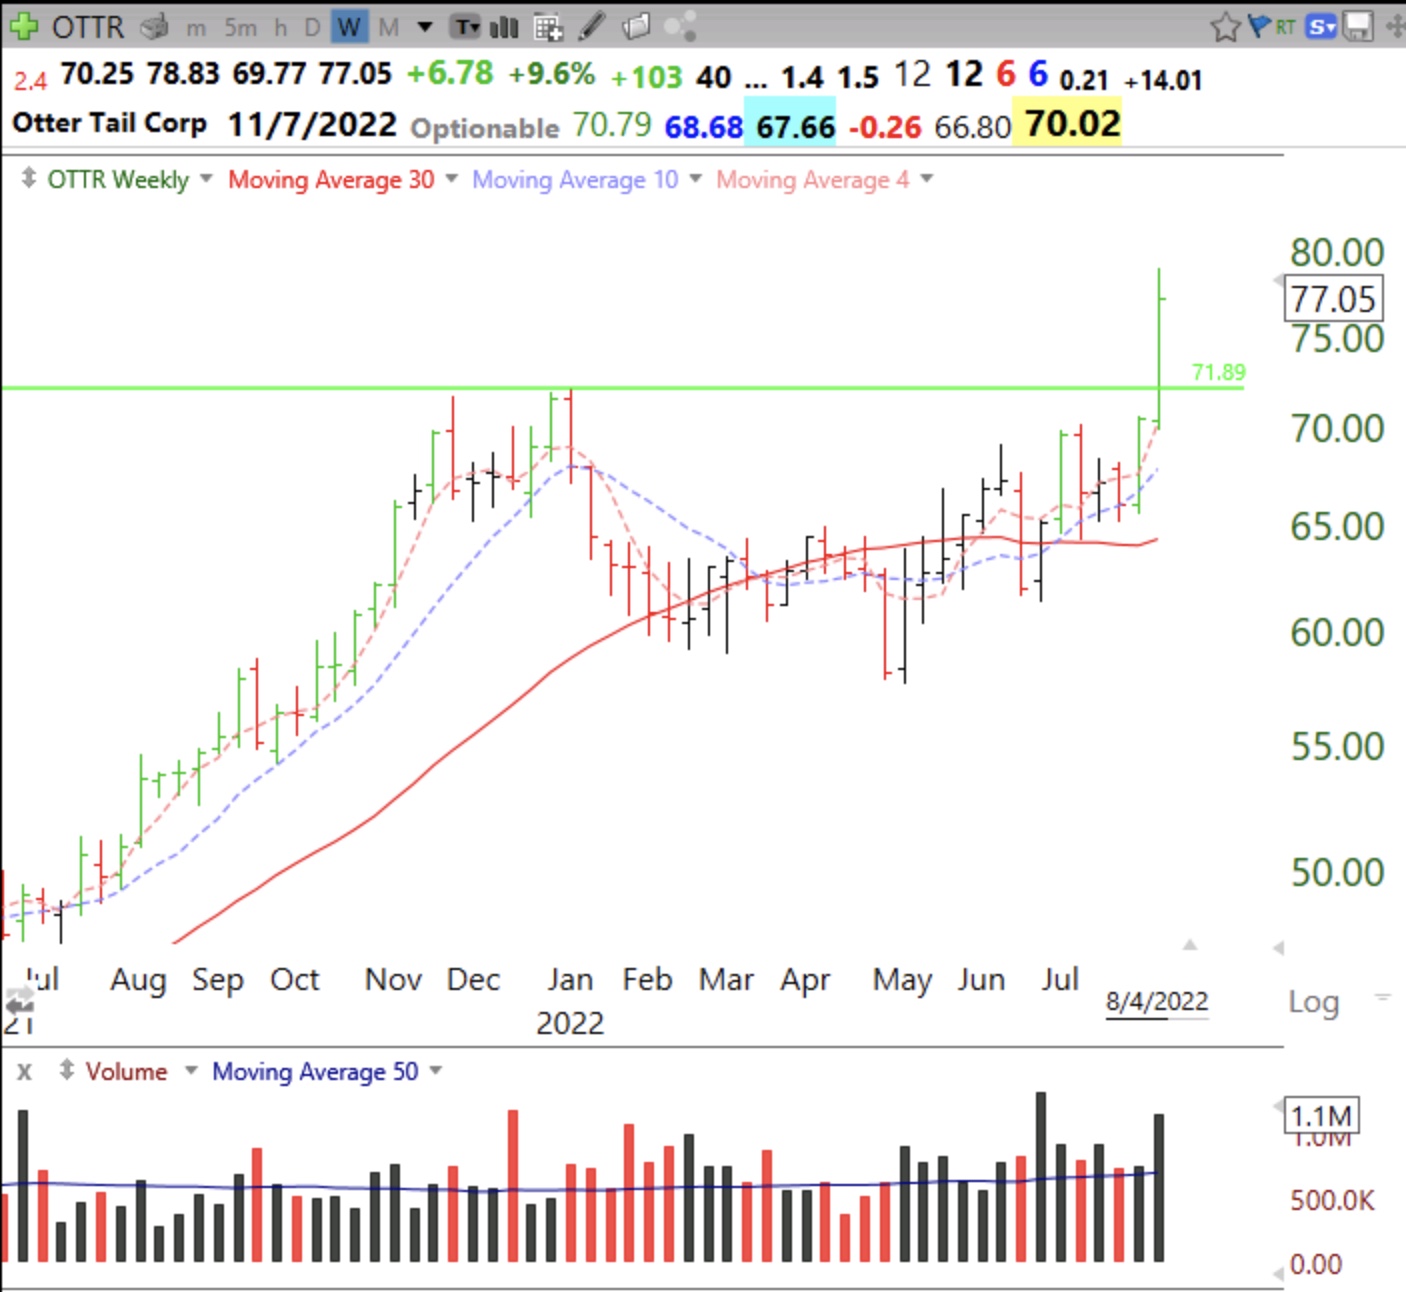
We still have yet to get 100 new yearly highs among US stocks that will incease the GMI to 6/6. This market continues to climb. However, only 2 stocks came up in my Weekly Green Bar scan of 806 stocks in my IBD/MS watchlist. DGII and OTTR have also had GLBs this week. Here are their weekly charts. Note their volume through Thursday has already exceeded their typical full week’s volume. Part of my scan requires that RS (relative strength vs SPY) to be at a 20 week high. The weekly green bar on the chart represents a bounce up off of a rising 4 week average (red dotted line).
Hello Dr. Wish, I was wondering if you had a post explaining your setup? I also noticed your candles have 3 different colors and am curious about that if you don’t mind sharing. Love your work!
Hi Dr Wish. Thank you so much for the work you do. It is wonderful. Regarding the GLBs for DGII & OTTR, when do you consider them too extended to buy?
QQQ close above the 30 week average is not confirmed until the close tomorrow since it is a weekly price bar. I think we sell off tomorrow and close the week below the 30 week moving average and remain in an overall down trend.
There are many things to use. Floating above the 4 wk is a good sign that it may top out or rest.
Thank you. My daily charts are red or green for closing down or up from prior day. I have a green daily bar for bouncing up off of the lower Bollinger Band. On a weekly I have a green bar for a bounce up off of a rising 4 week average.