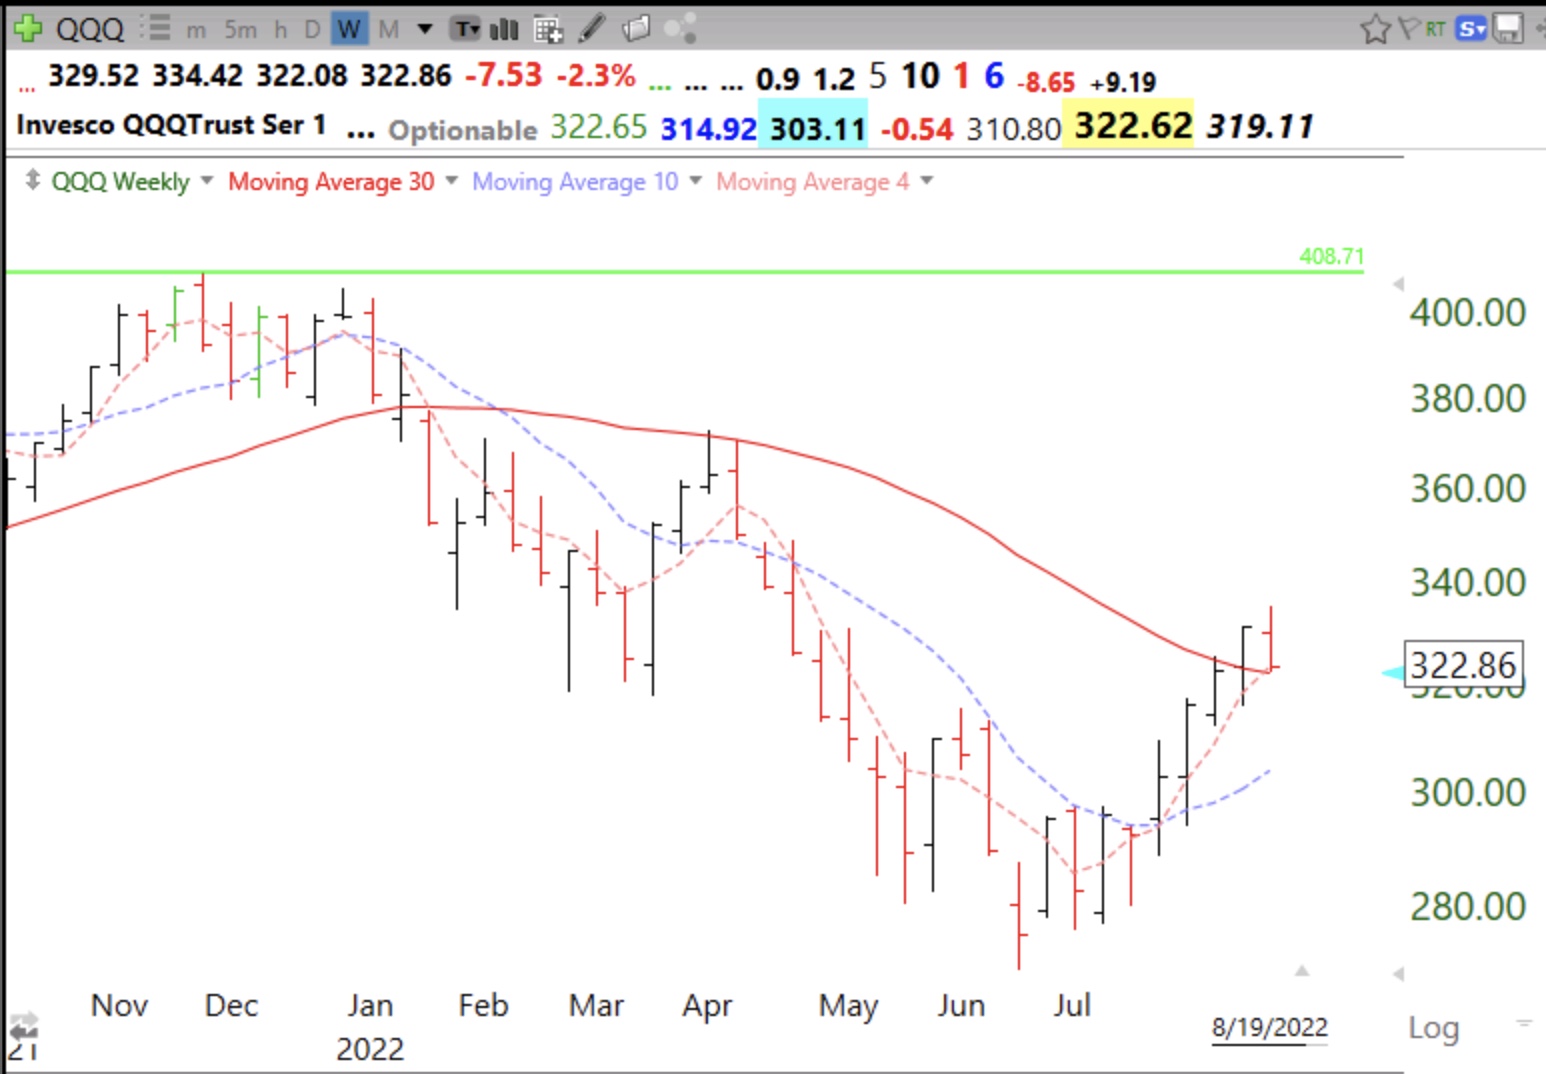
The weekly chart of QQQ shows that it retraced to its 30 week average (red solid line) last week. If it holds the 4 week average (red dotted line) and the 30 week average this week I think the new up-trend is intact. If it closes this week below the 30 week and the 4 week, we are likely in store for much more weakness.
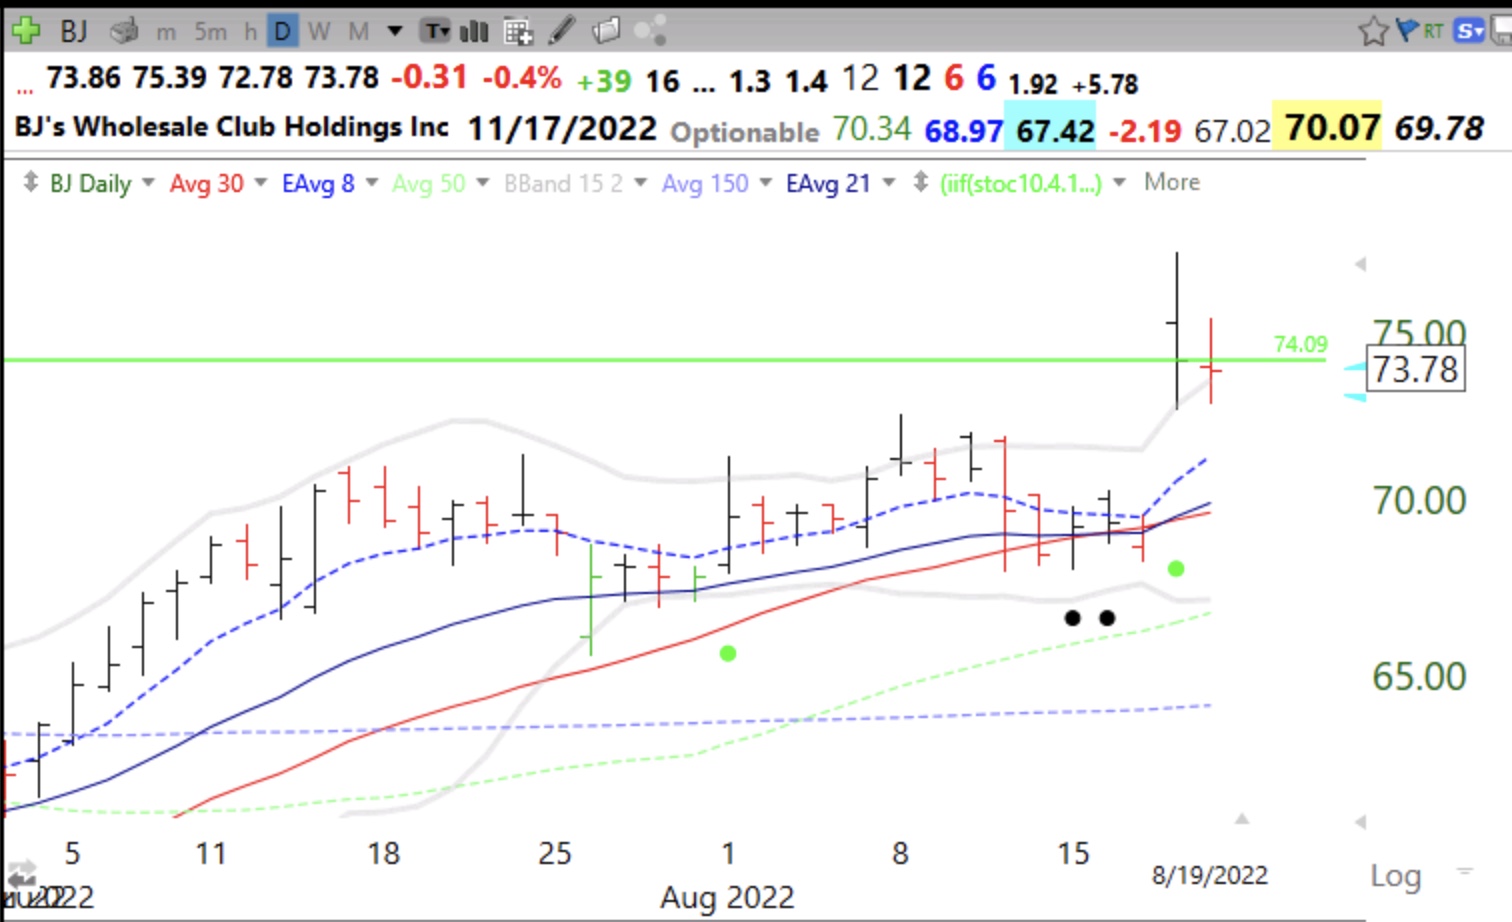
I tweeted earlier Sunday, @wishingwealth, about the need for more examples of failed break-outs to help people learn how to recognize when a break-out fails. Many break-outs fail, especially in a declining market. BJ had a failed green line break-out on Friday. It failed to close above its green line (74.09) on Thursday and closed below it on Friday. When a stock closes back below its green line I must sell out. If a set-up is violated one must always sell. If BJ were to close back above its green line, it might be a buy.
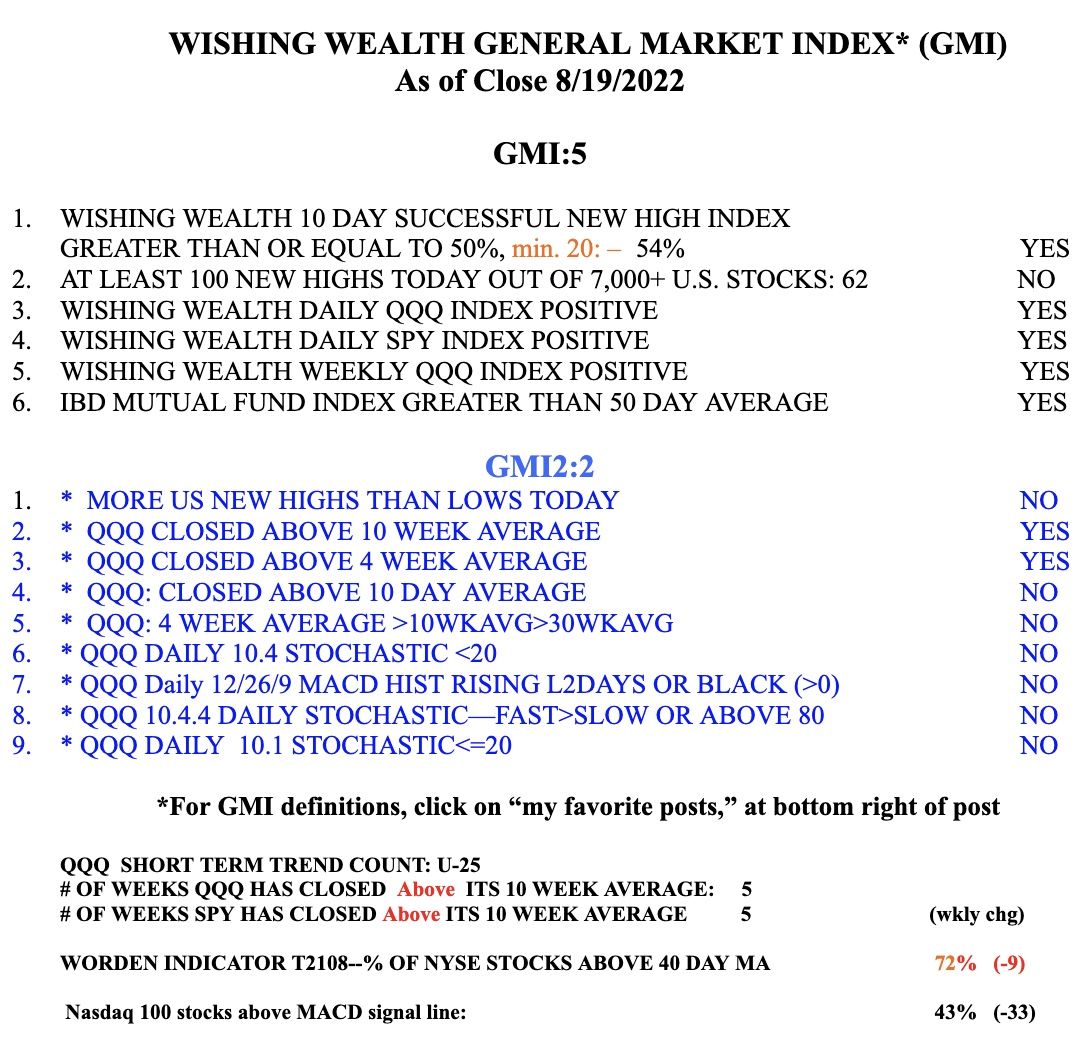
The GMI remains Green and is at 5 (of 6). Note however how few (2) of the GMI2 components are positive. The GMI2 is sensitive to very short term moves. Friday was a weak day.
Dr. Wish, follow you on Twitter and here on your blog, great stuff. Thankful for you sharing your comments etc. question, using the 4 week MA, any particular reason using this vs. another weekly timeframe? Assume it’s more for short term signal?
Dr. Wish, liking CEIX. Been going up since you mentioned it a few weeks ago and hit an all time high today as well
I find the 4 wk and 10 wk averages are the ones to watch as long as you are in a Stage 2 up-trend.