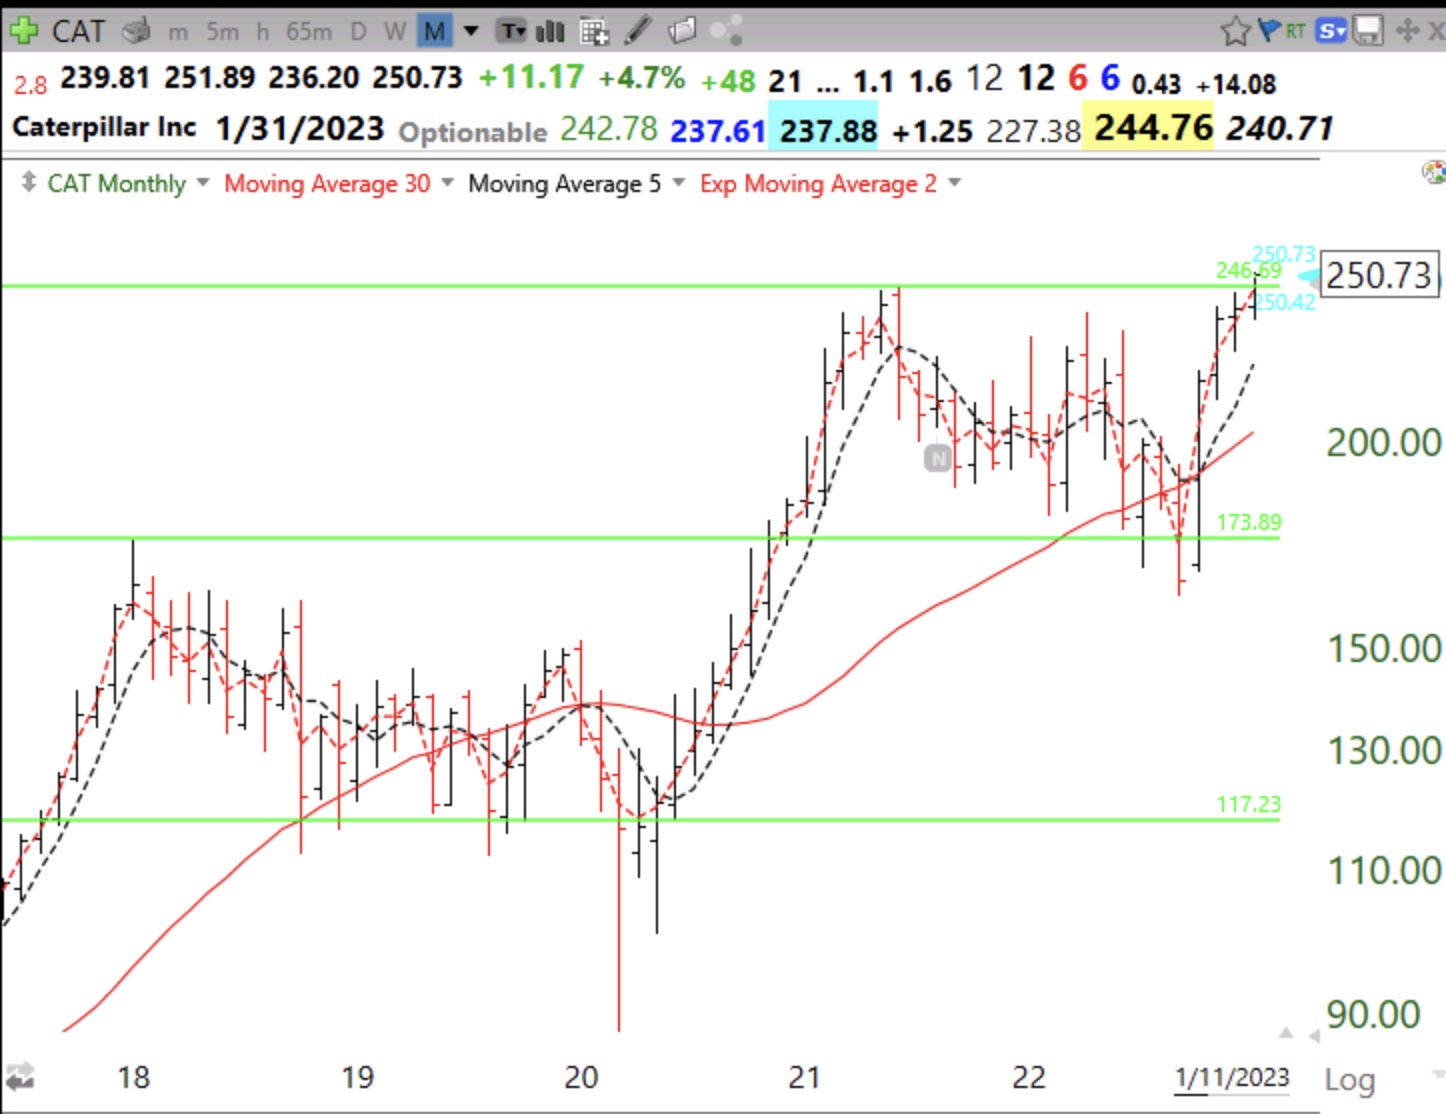
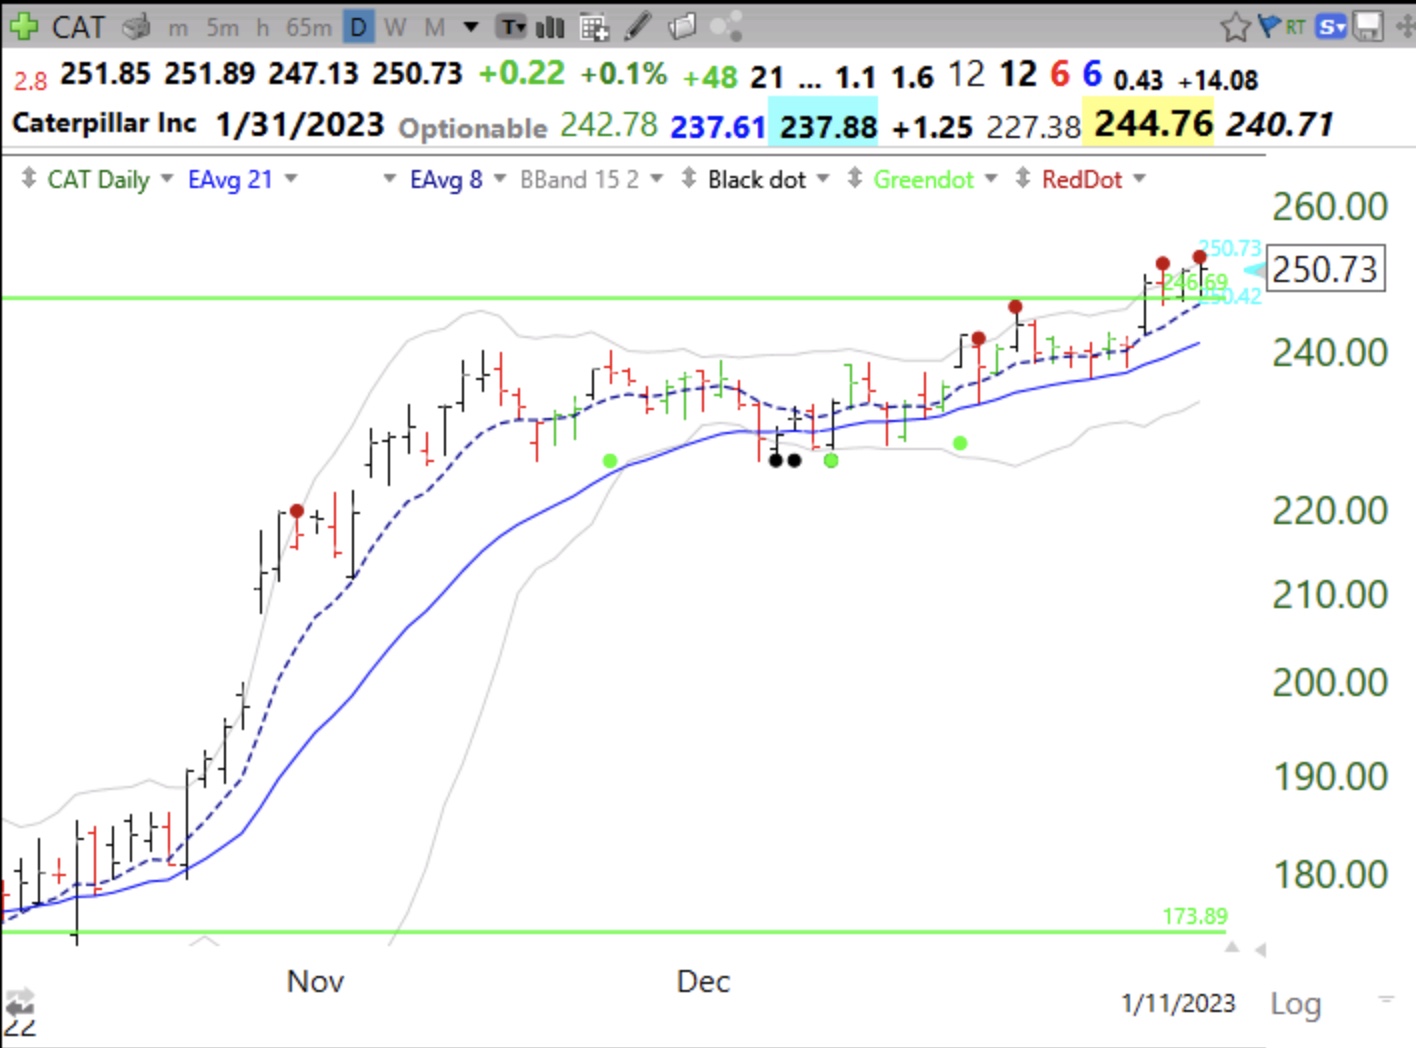
I draw a green line on a monthly chart at a peak price that is not exceeded for at least 3 months. When it eventually closes above the green line it is a GLB, or green line break-out. Think of it as a stock that reaches an all-time high (ATH), rests, and then breaks out again. As long as the stock closes above the green line, I hold it. I sell if it closes any day back below the green line. CAT had a recent GLB. See its monthly and daily charts. The strongest stocks trade at ATHs, especially after a bear market. I don’t buy fallen angels. (The red dots on the daily chart show when a stock may meet resistance at its upper 15.2 daily Bollinger band.)