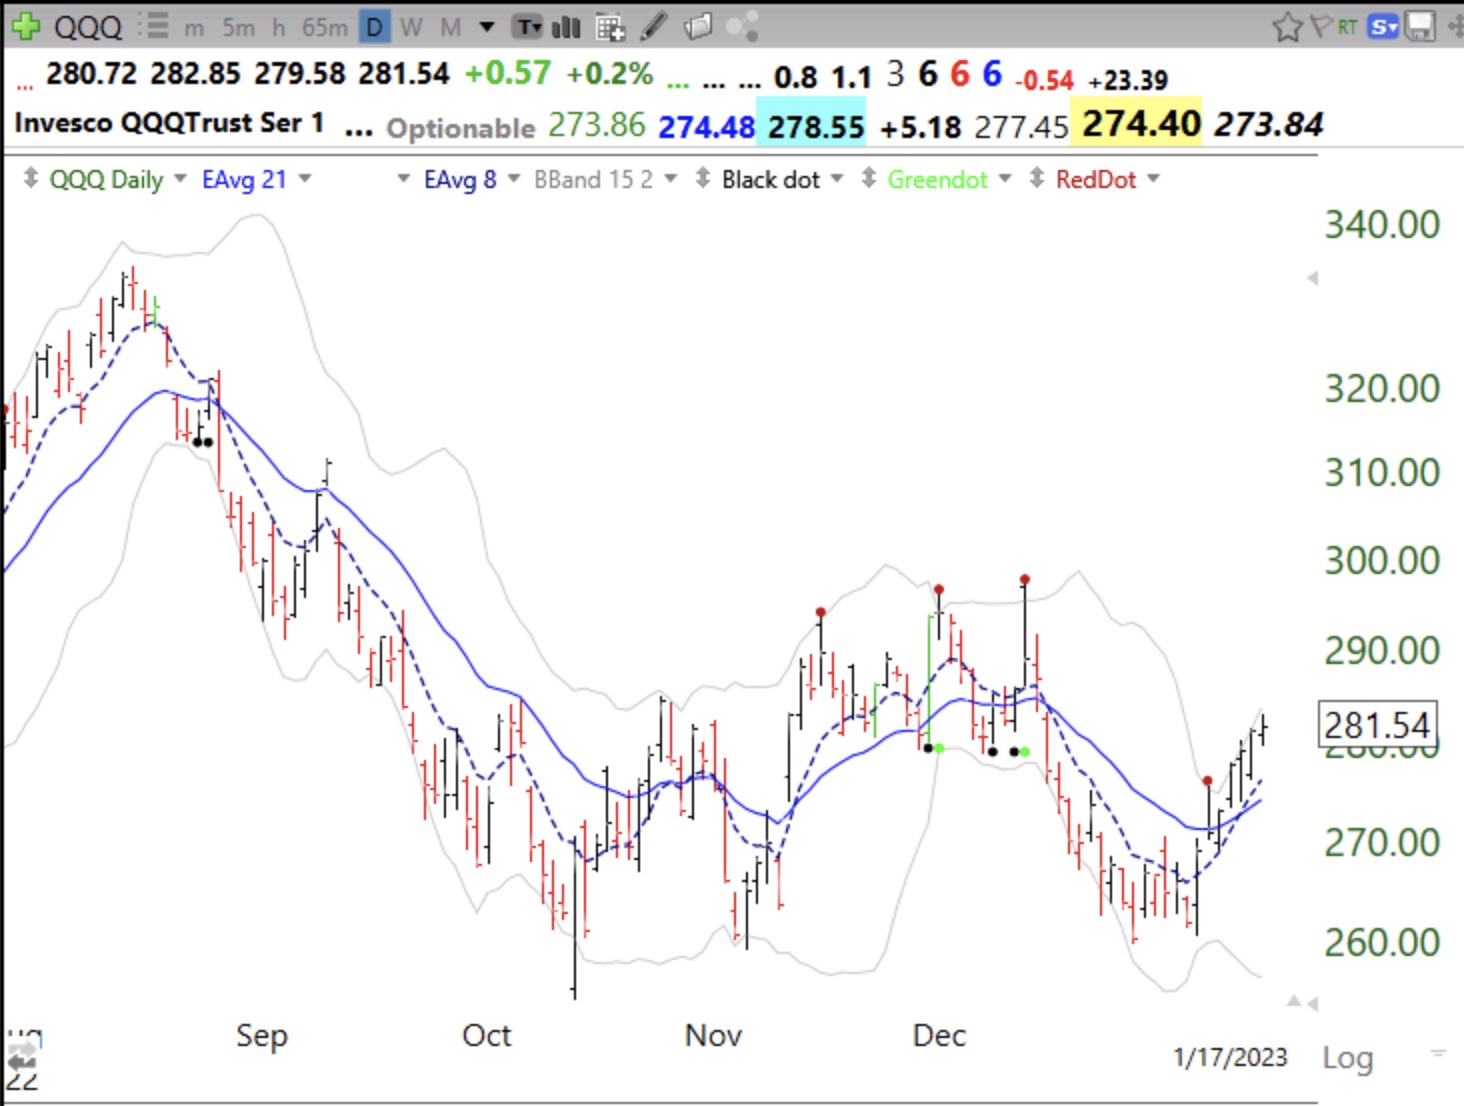
Blog Post: Day 3 of $QQQ short term up-trend, see daily chart Tuesday, January 17, 2023 @ 10:02 pm by Dr. Wish GMI4/6 GMI-26/9 T210874% The bottom seems to be holding and the 8 EMA (dotted line) is now above the 21 EMA on this daily chart. Will it hold or break down like it did in December? Only time will tell. Share this:EmailFacebookTwitterLinkedInPrintMorePocketPinterestTumblrRedditTelegramWhatsApp Related