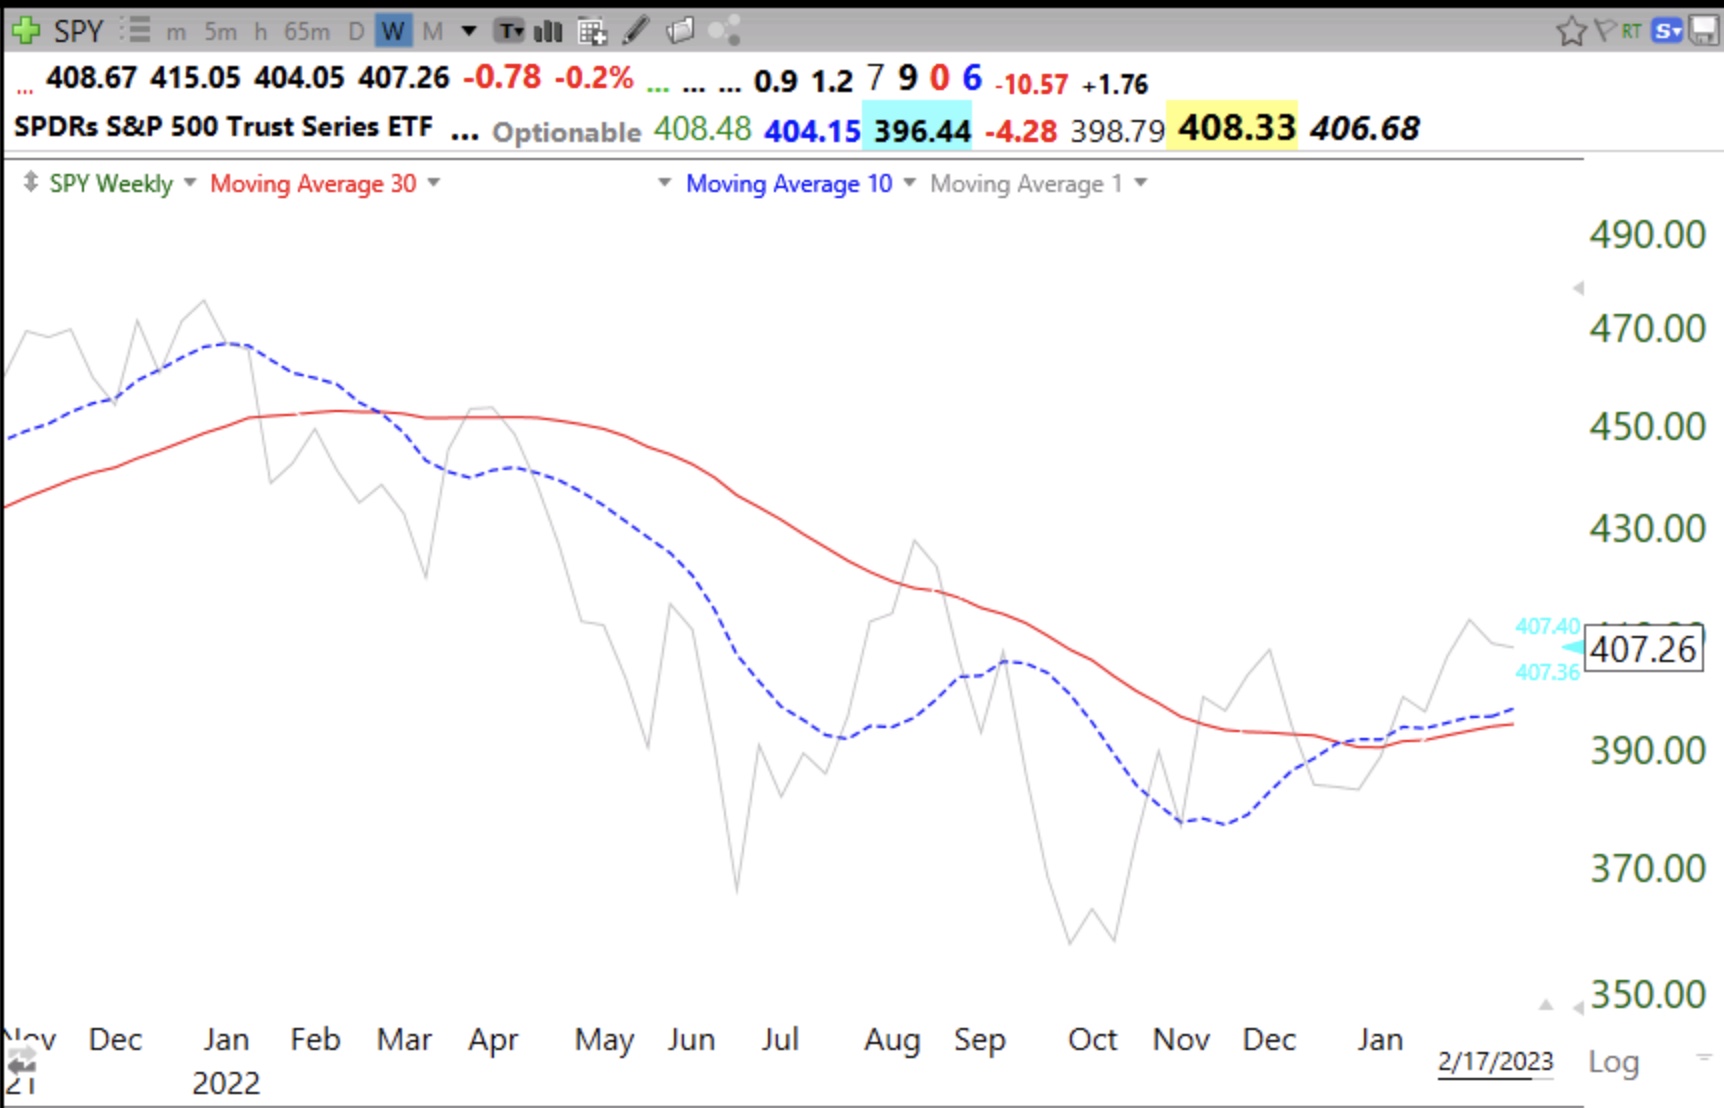
This weekly chart of SPY shows the 10 and 30 week (red solid line) averages and the gray line shows the weekly closes. As long as the 10 week is above the 30 week average the market is in an up-trend. Note the closes are leading the index higher.
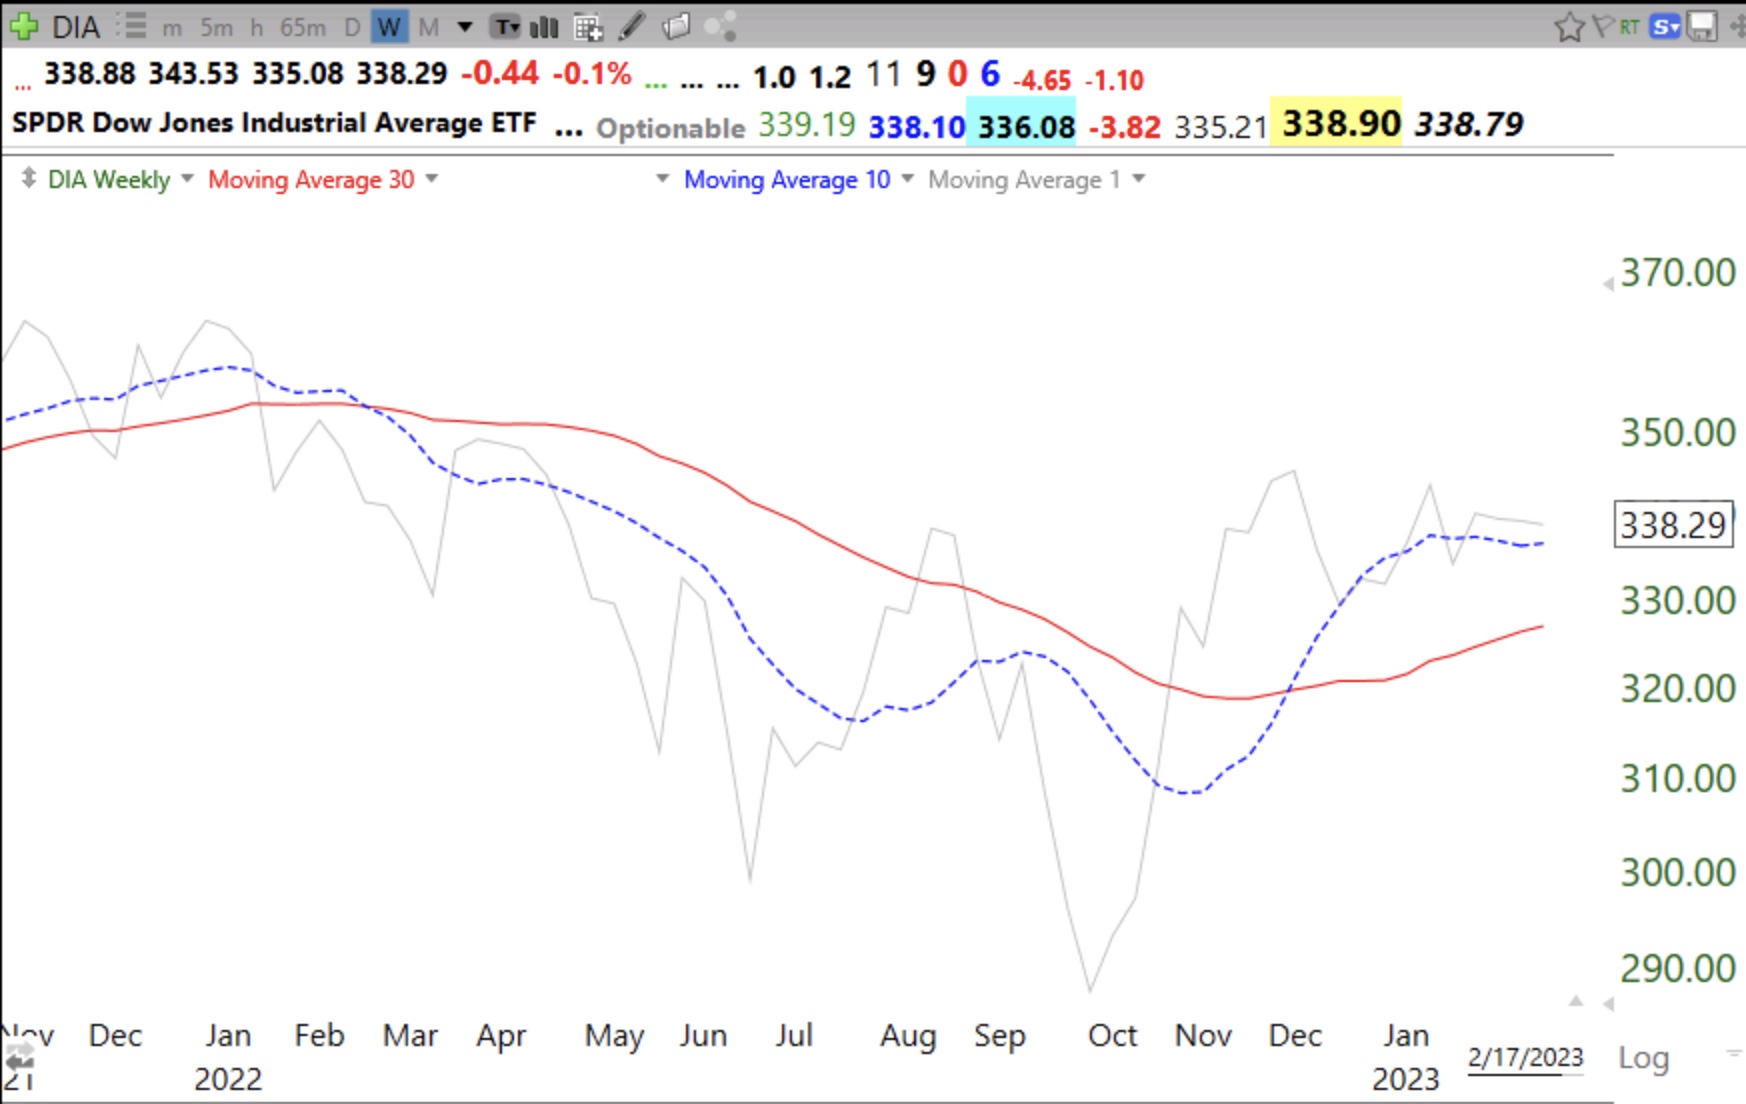
The DIA is even stronger.
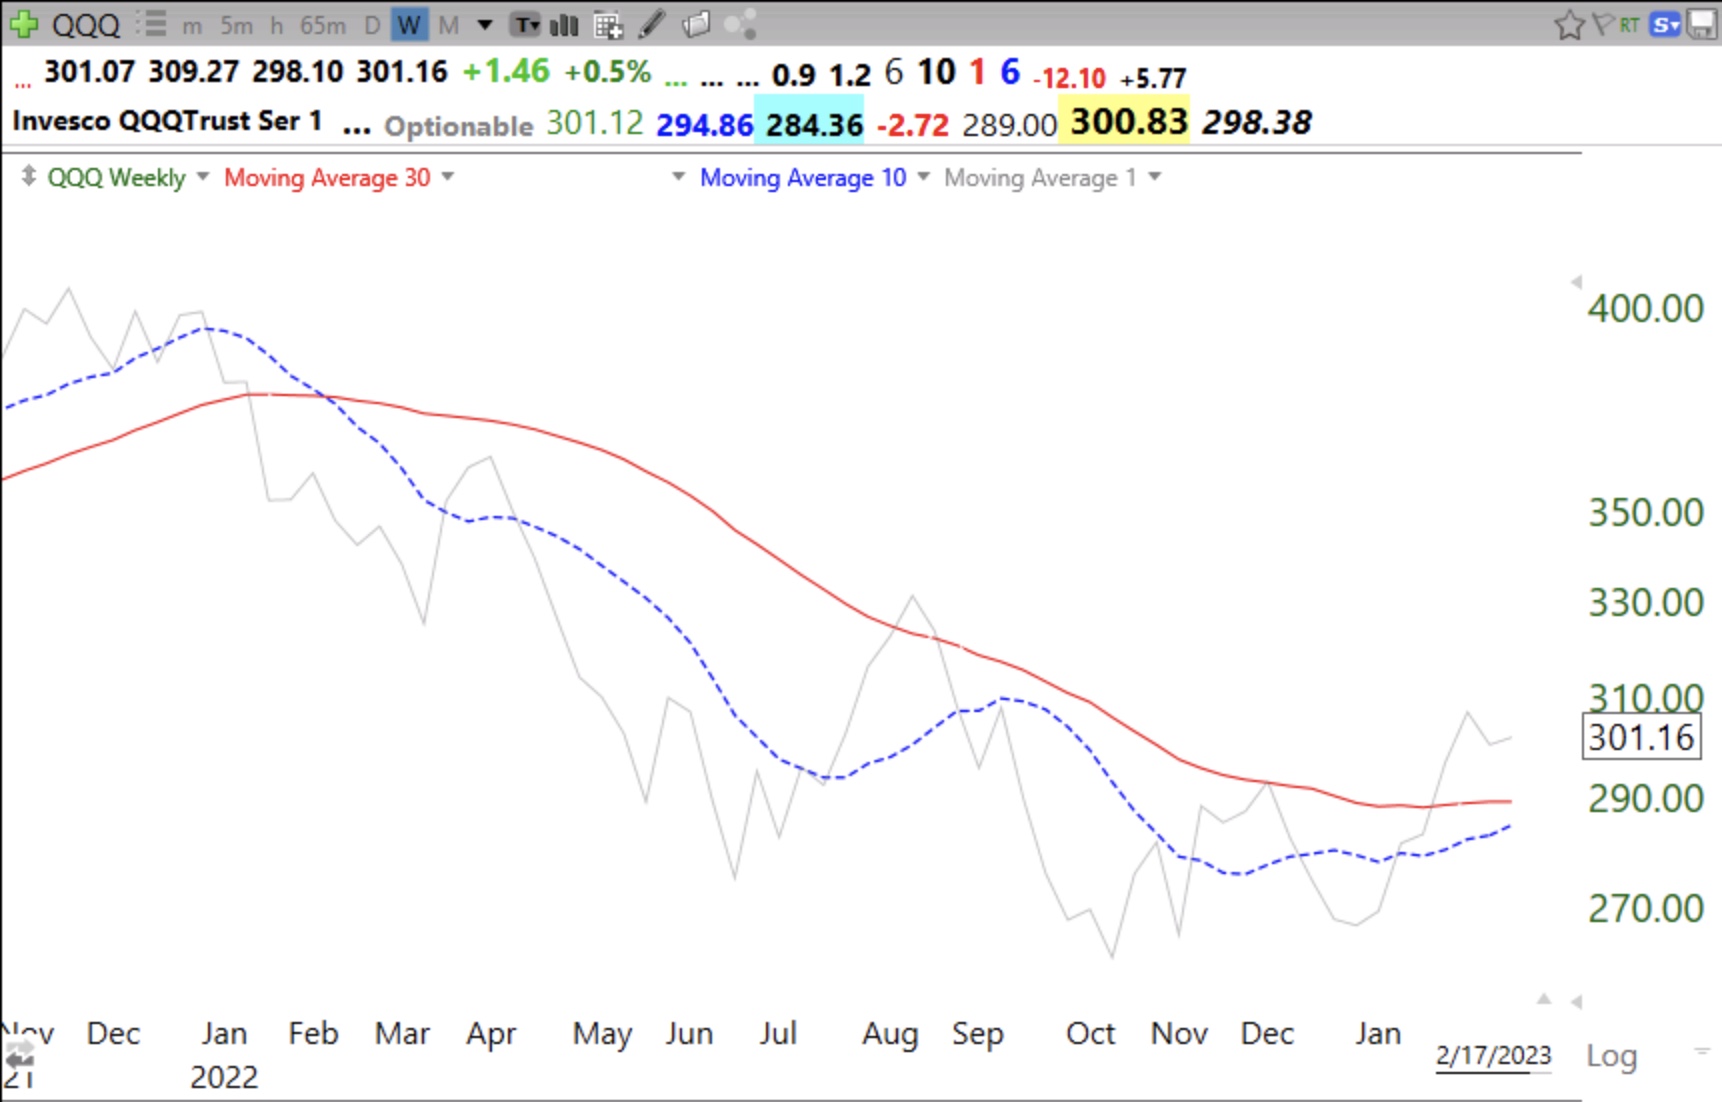
QQQ is lagging but pointing upwards.
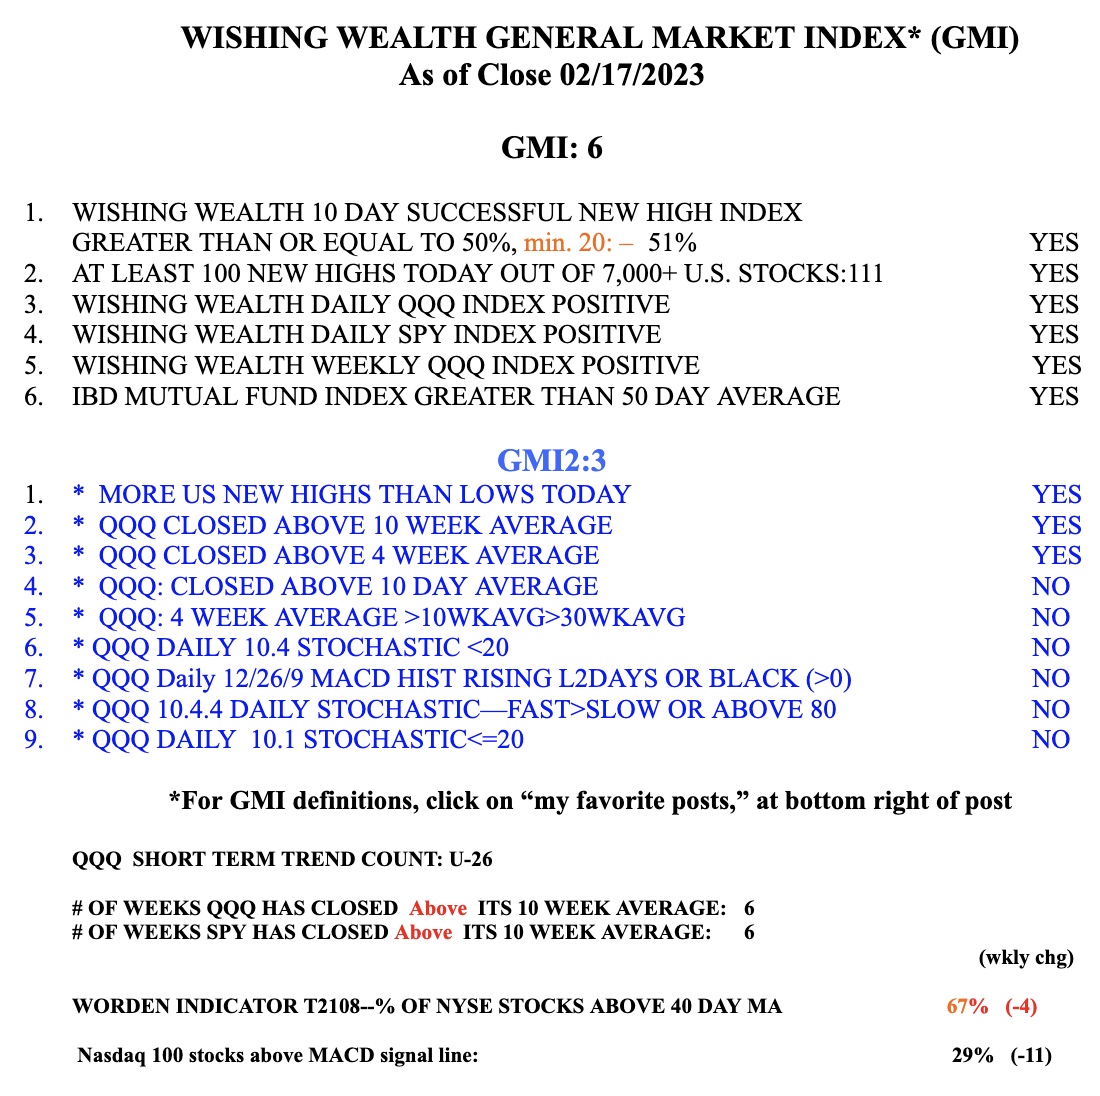
The GMI remains Green at 6 (of 6).
Hello Dr. Wish, i think that to follow the trend in the short term it is better to follow the percentage of shares above the 50-day moving average.
https://stockcharts.com/h-sc/ui?s=%24NAA50R&p=D&yr=2&mn=0&dy=0&id=p27509096456
Thank you very much for sharing your knowlegde.