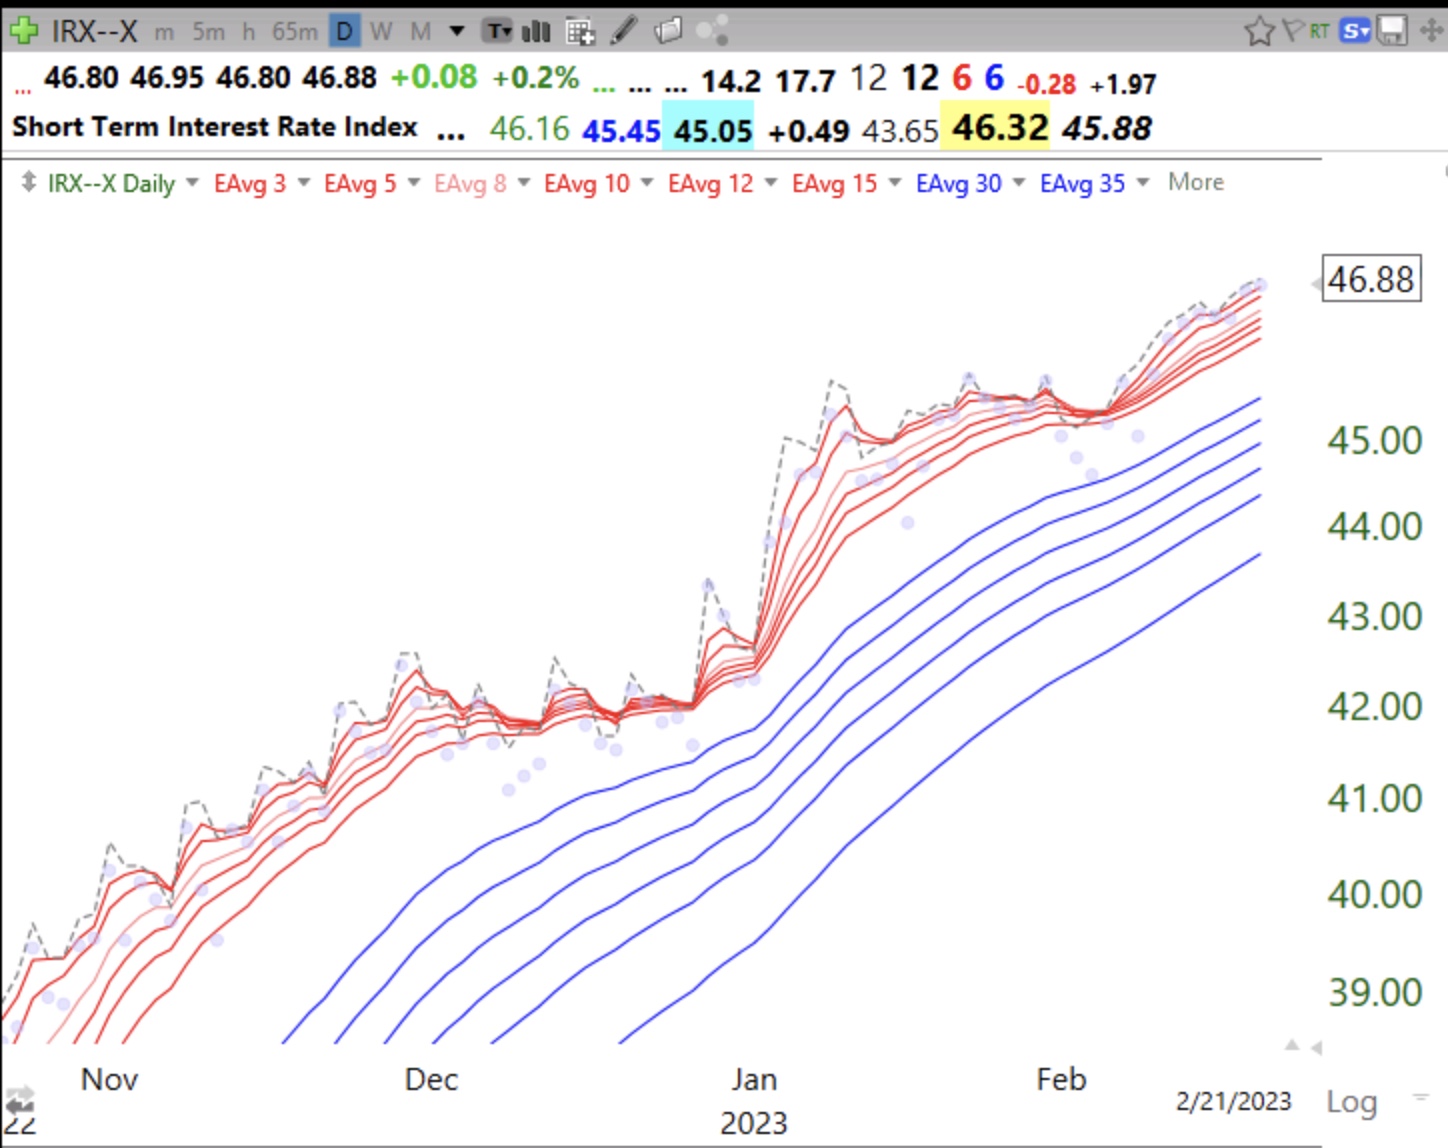
My QQQ short term trend indicator could turn down with a couple of more days of weakness in QQQ. The GMI could also flash RED. I am 95% cash in my trading account. With earnings season over, there is very little good news to propel stocks higher. There is often a post earnings season lull in the markets. And interest rates are rising. Look at this short term interest rate indicator. All of the shorter averages (red) are rising above the longer term averages (blue) in a daily RWB up-trend.
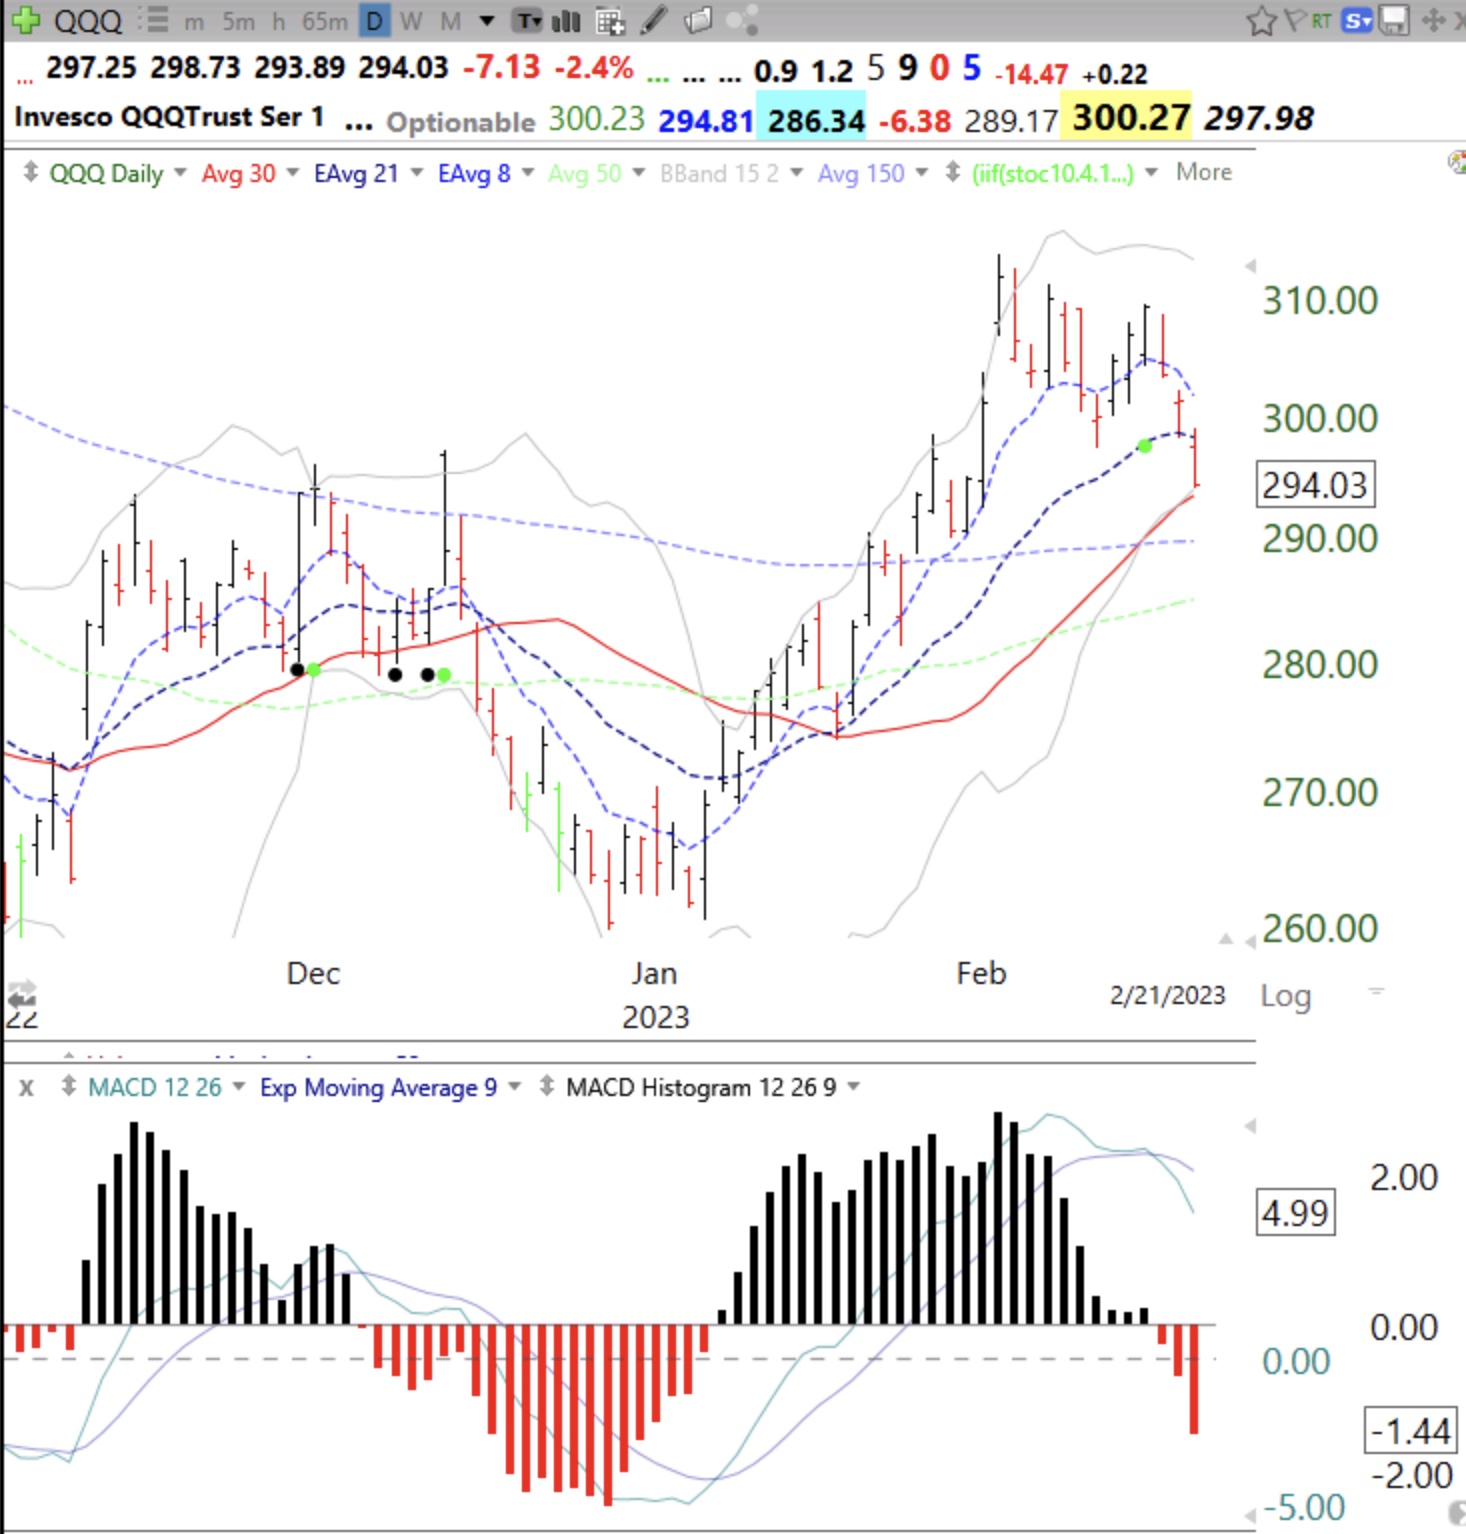
MACD histograms are an interesting indicator I use to identify a likely change in the short term trend. They often move up or down before the change in trend is apparent in the prices. You can more easily see the histograms gradually gaining or losing strength. Check themselves out for yourself. The daily MACD histograms of QQQ have turned red, a sign of a developing down-trend. Note how they declined even when prices bounced up a few days ago. I will watch for these histograms to start rising and to turn black again.
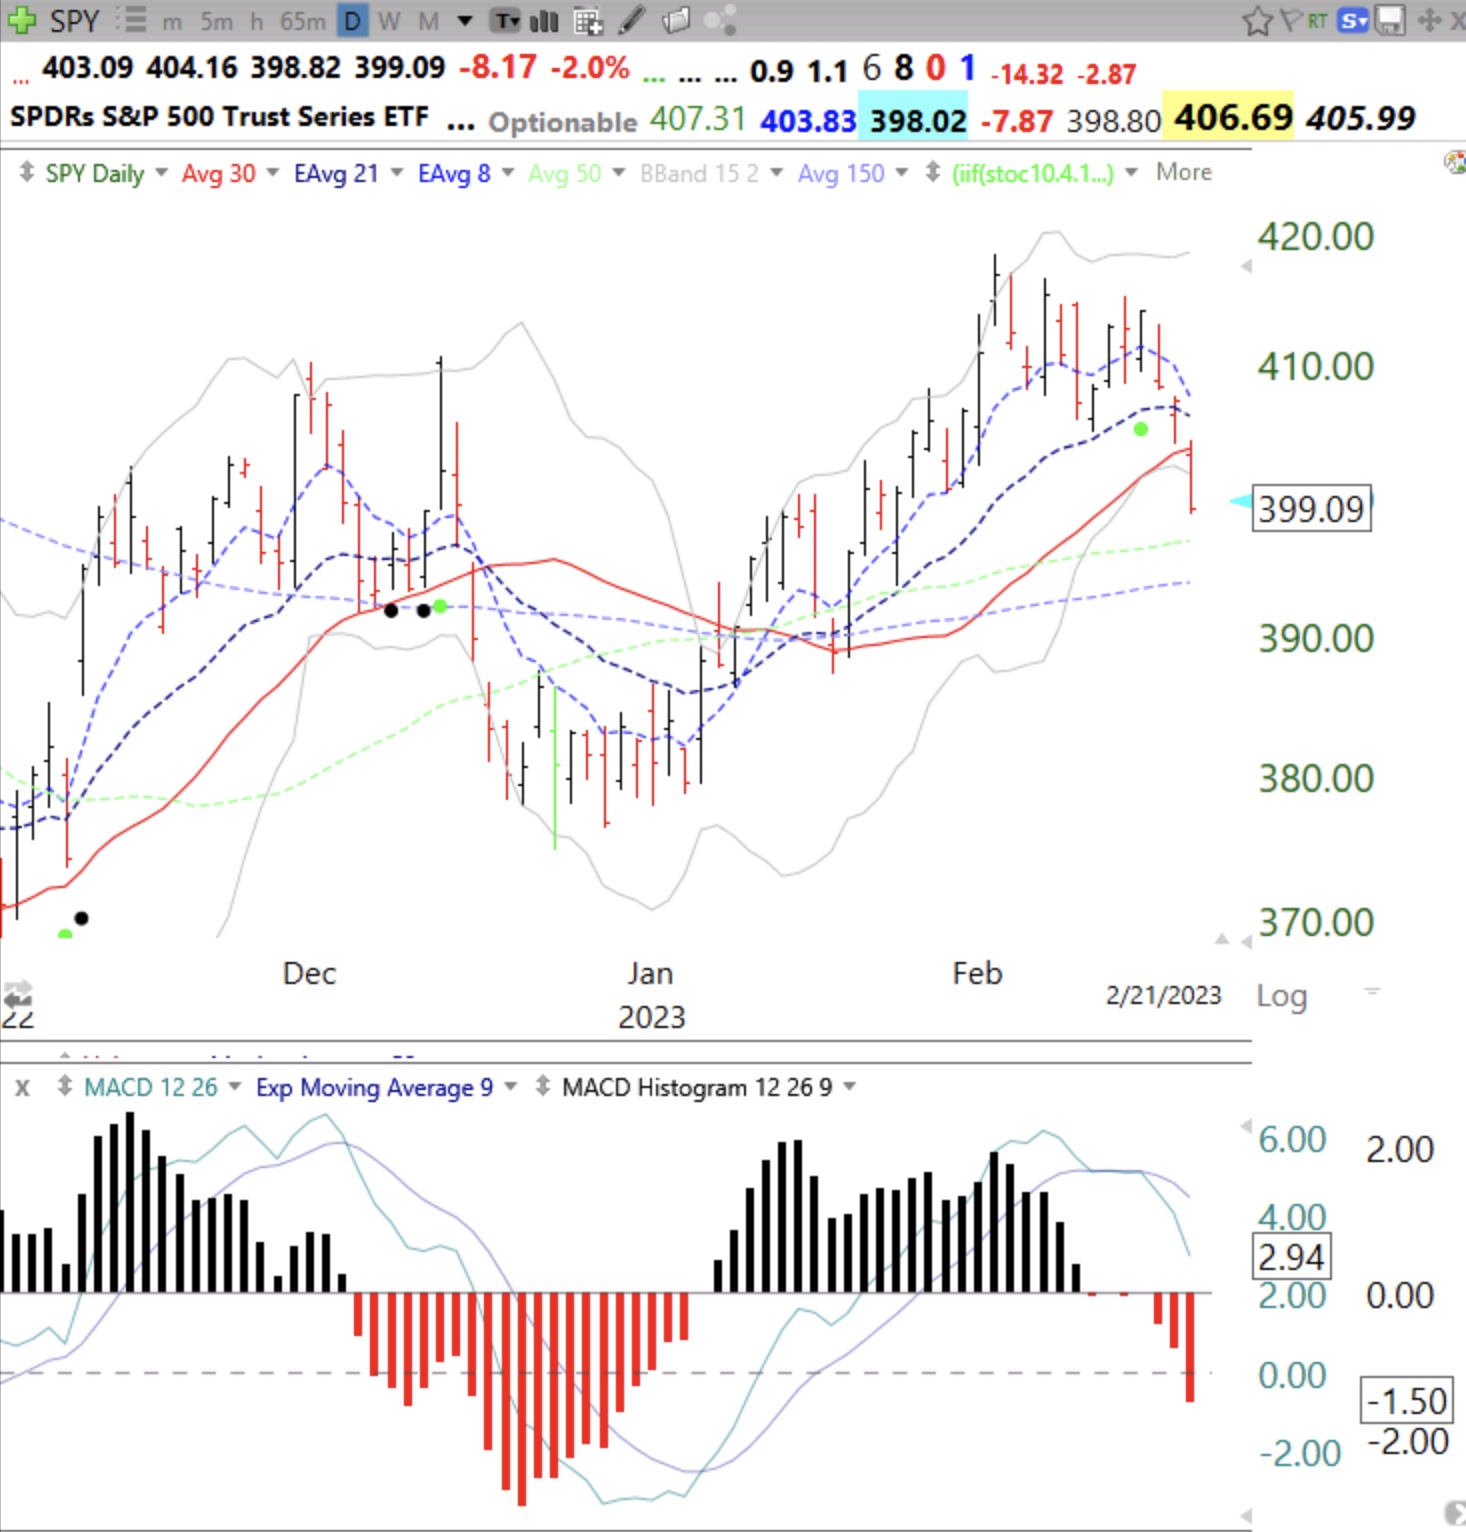
Here is SPY. Note how they rose at the recent bottom before they turned black.
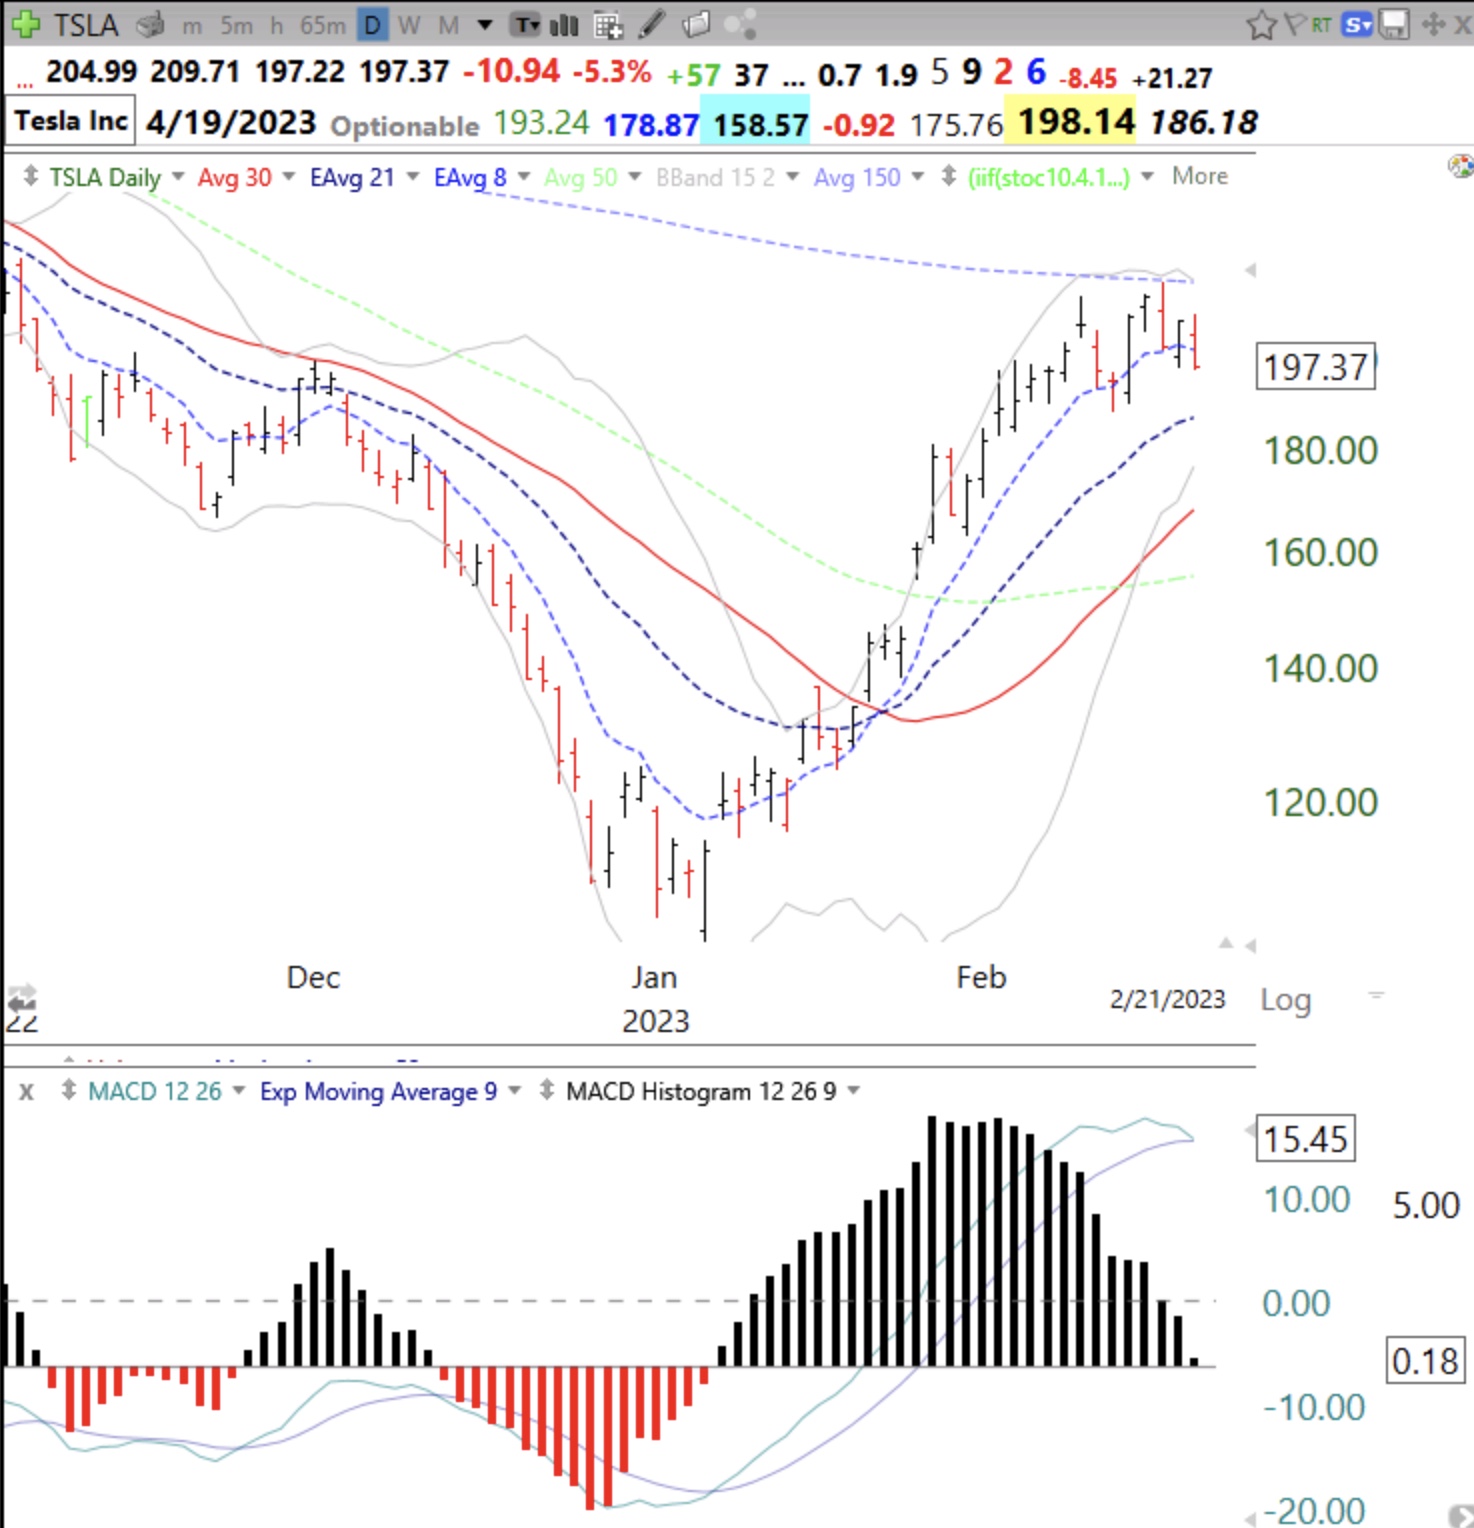
And TSLA is about to turn red. Note how the red bars started to rise in early January before price got going, called positive or bullish divergence. (Thanks to my stock buddy, Judy, for teaching me how to interpret the MACD histogram indicator years ago.)
Dr Wish. You are awesome. Thank you.
Great knowledge Doctor Wish
Thanks, Dr. Wish, for sharing your insights and experience. Where can I find a more thorough explanation of how you identify short-term trends?