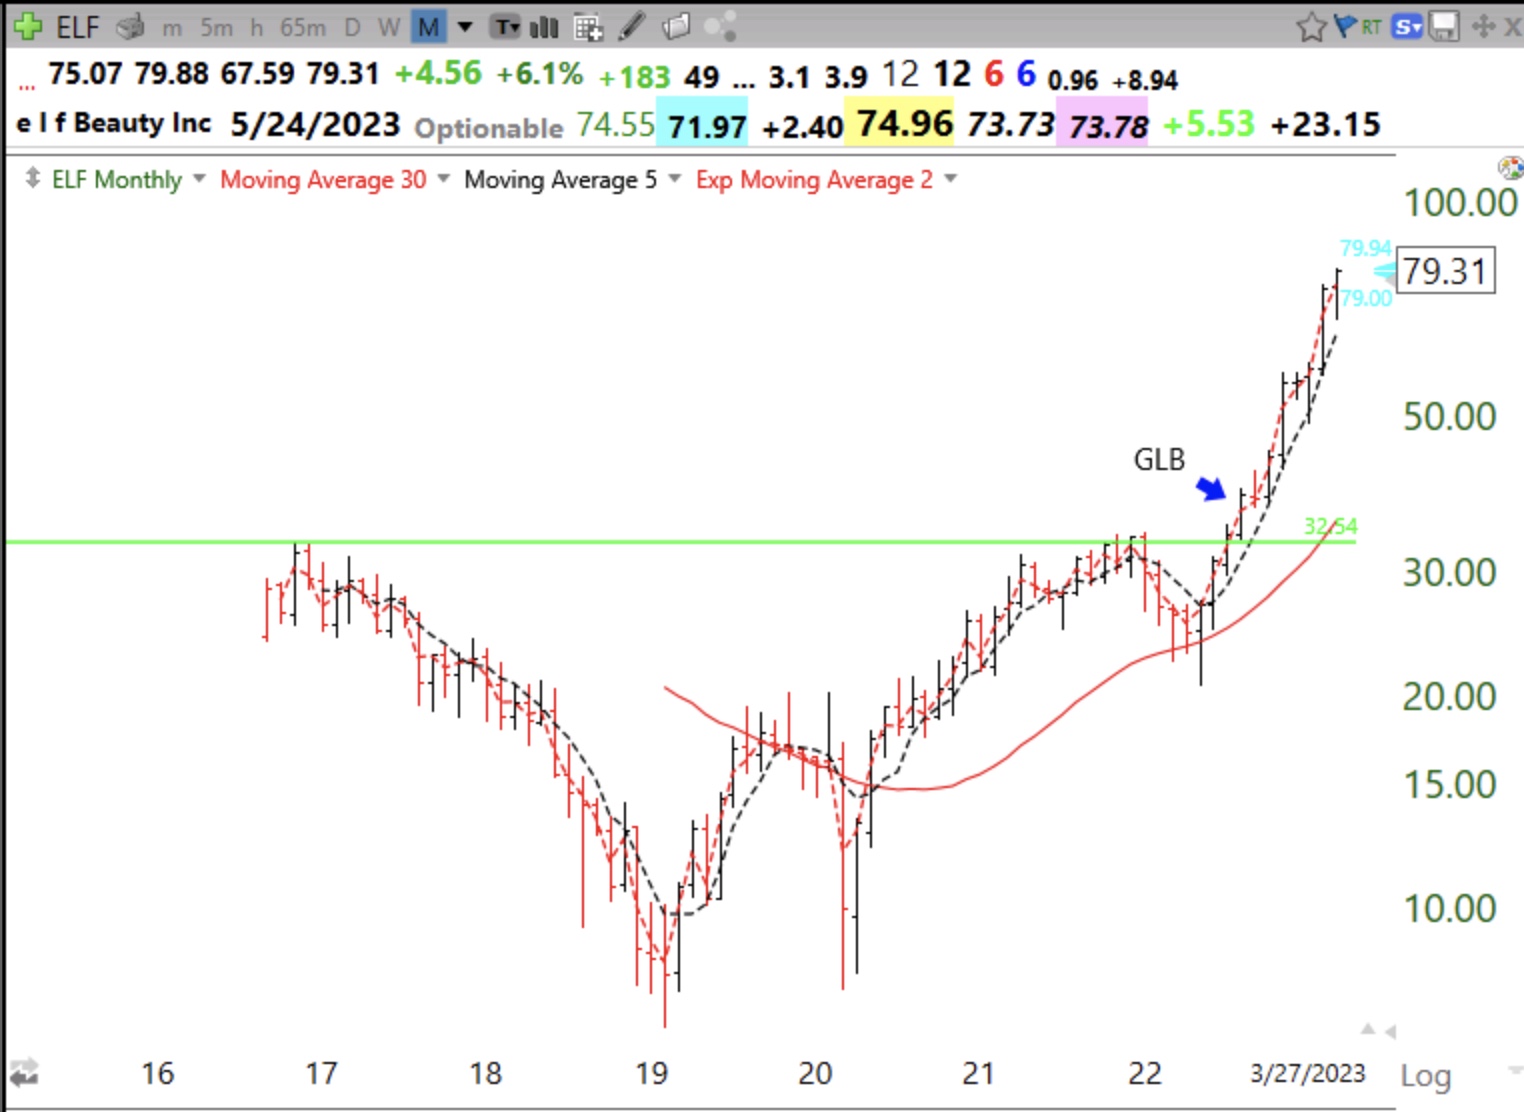
On a weekly chart one can see how nicely ELF has behaved since its GLB last August. It only closed below its 10 week average (blue dotted line) twice. The monthly chart shows why I drew the green line where I did. How many of us would wait 7 months for our stock to double? Most of us would become impatient, especially if we focused on the daily chart shown below.
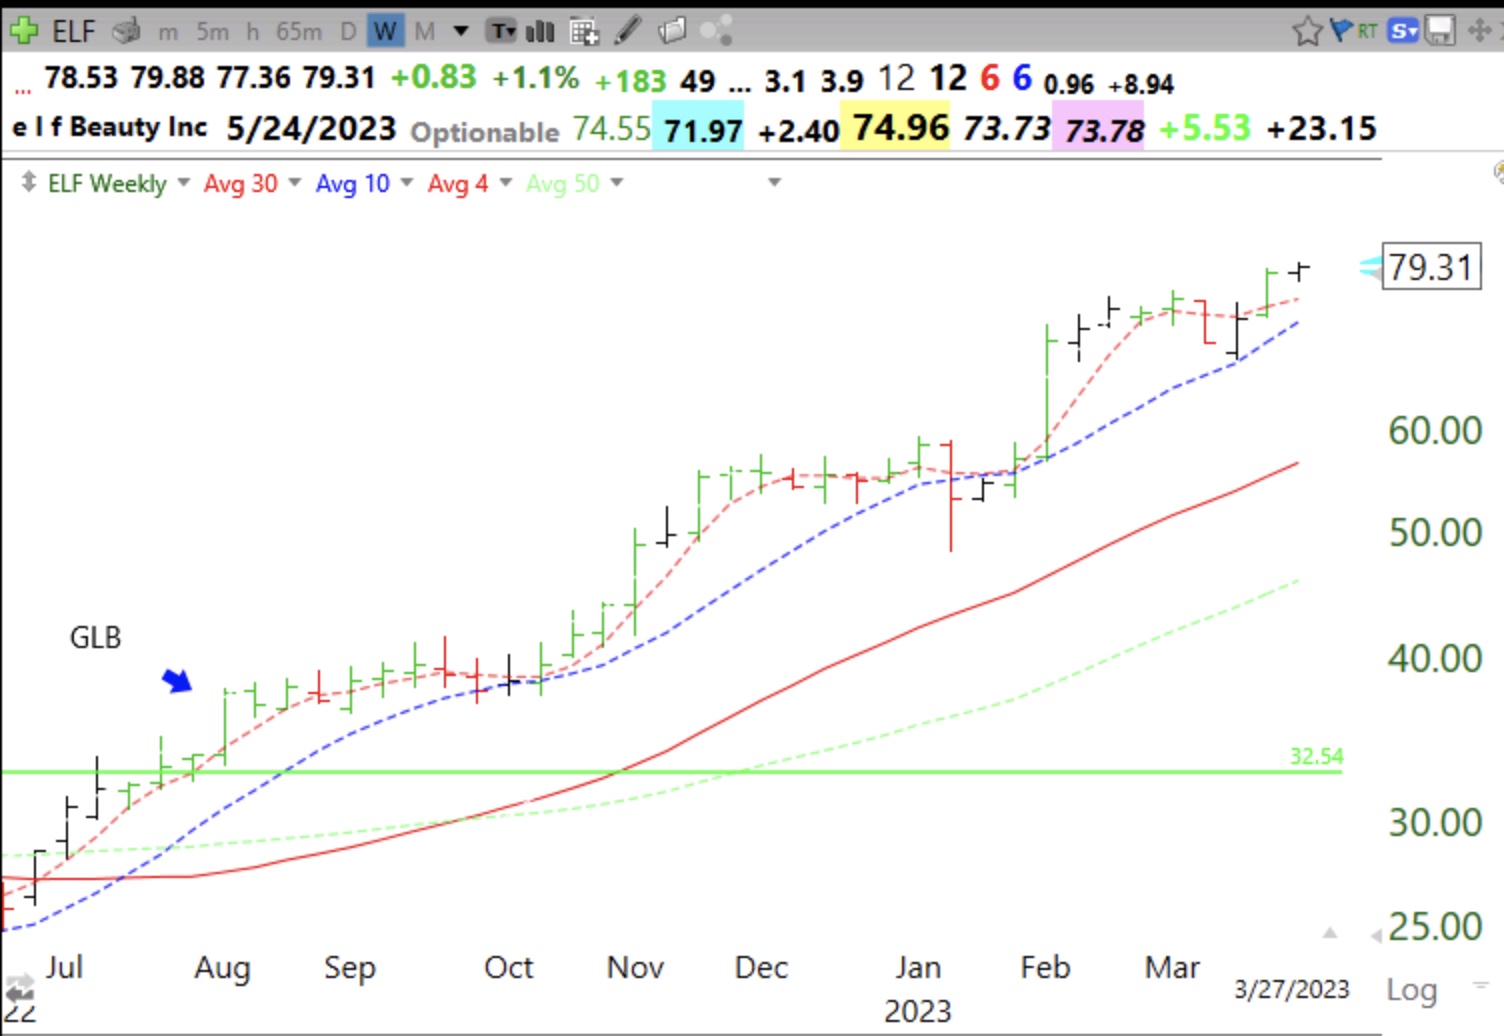
The daily chart shows how one might have been shaken out of ELF multiple times, especially in January. I try to always check out the weekly chart before selling.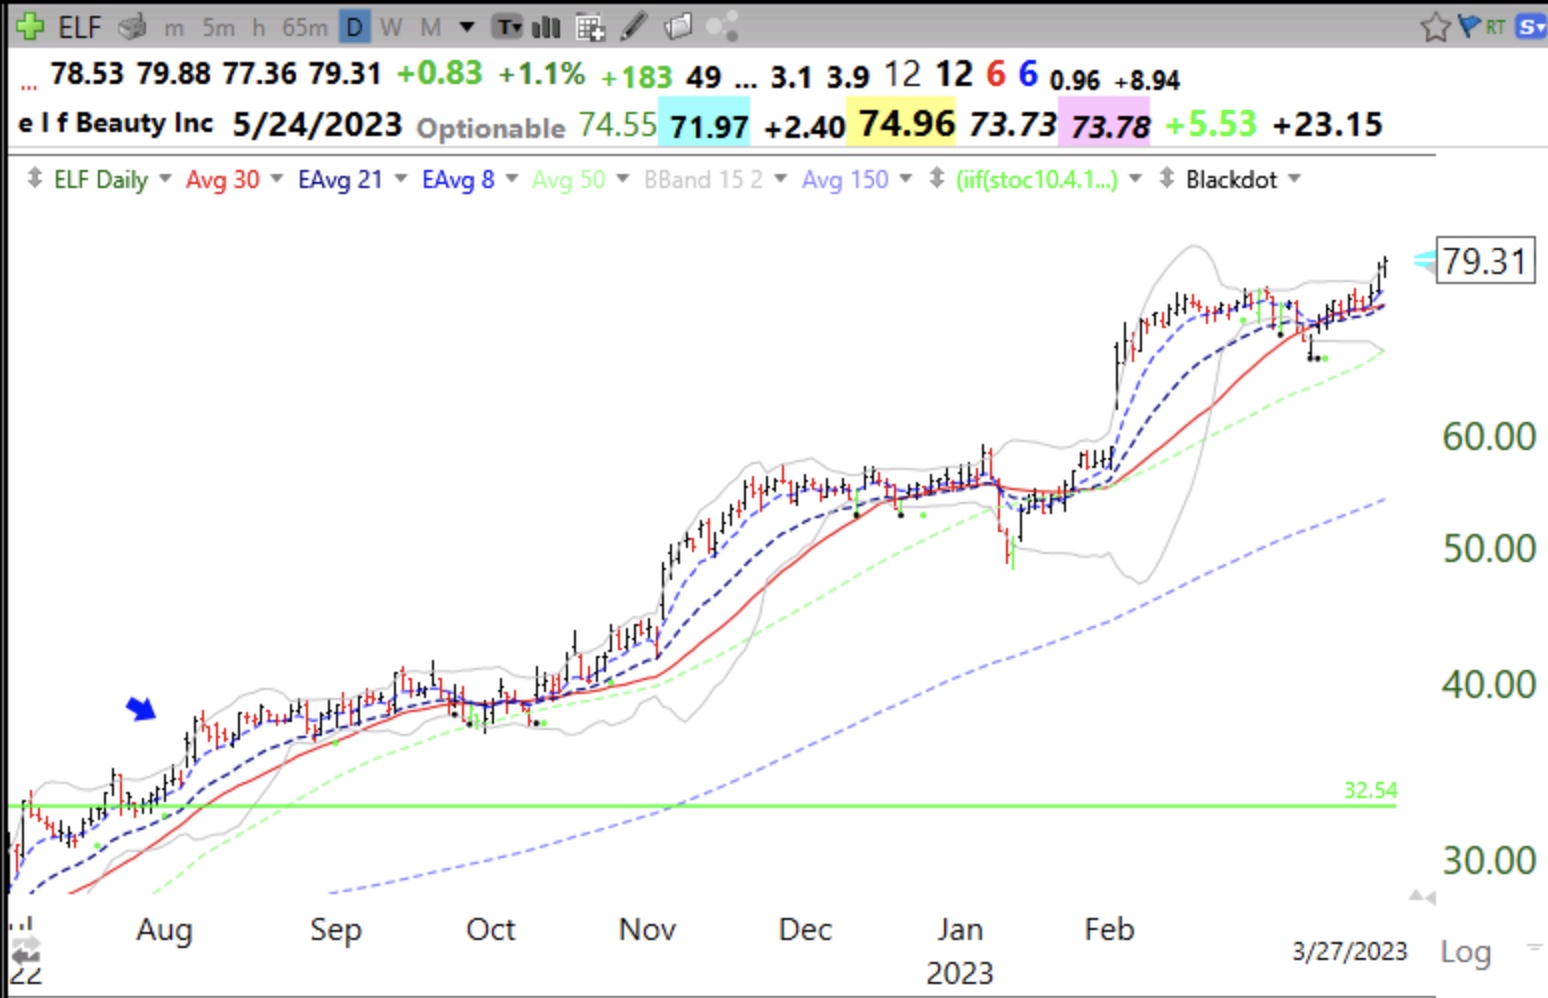
Yeah, elf has been a slow burn missed opportunity for me, been watching it since that breakout, got in twice and was shook out, only to see it double ♂️. The weak general market didn’t give me confidence to stick with it. So many others have failed during this period.