Blog Post: Day 18 of $QQQ short term up-trend; 72 US new highs and 20 new lows on Tuesday; My 10:30 weekly chart still shows $QQQ in a Stage 2 up-trend; see also charts for $WWE, $ZM

GMI4/6
GMI-27/9
T210843%

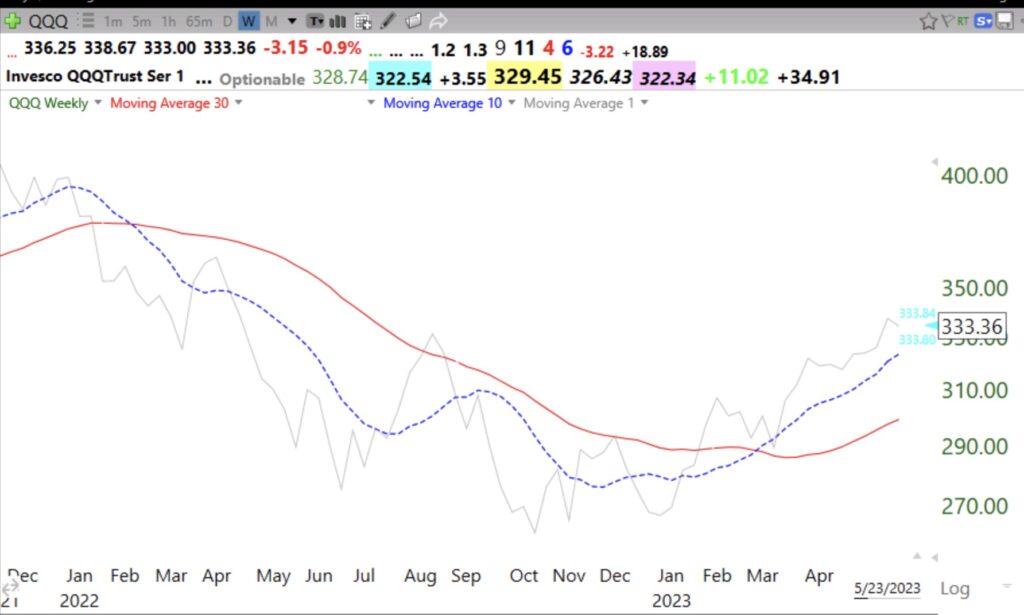
Note that the 10 week average (dotted line) is rising above the rising 30 week average (red solid line). In the past this has been the pattern marking the end of a major down-trend. Gray line is the weekly close.

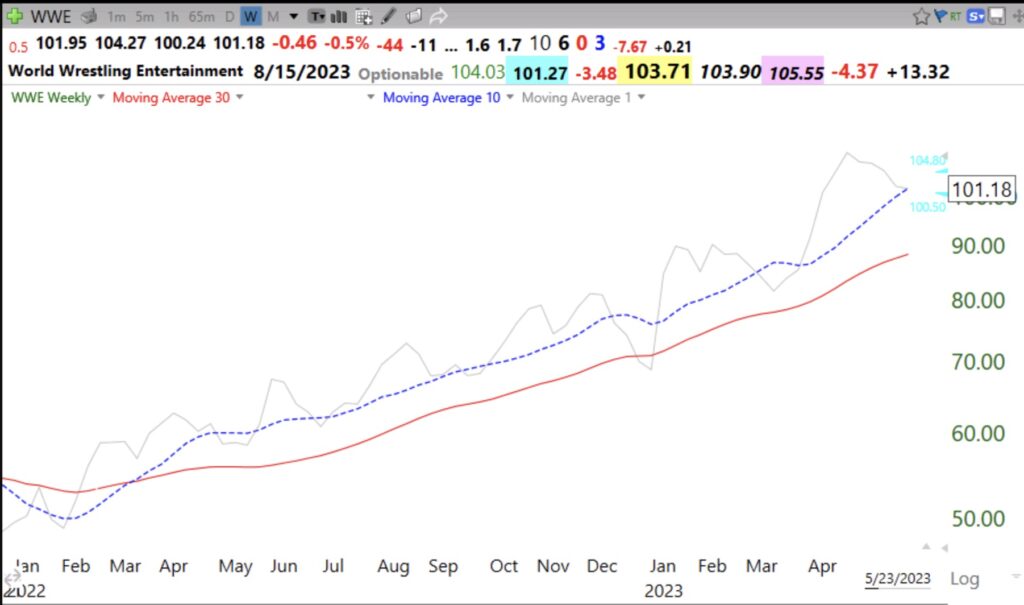
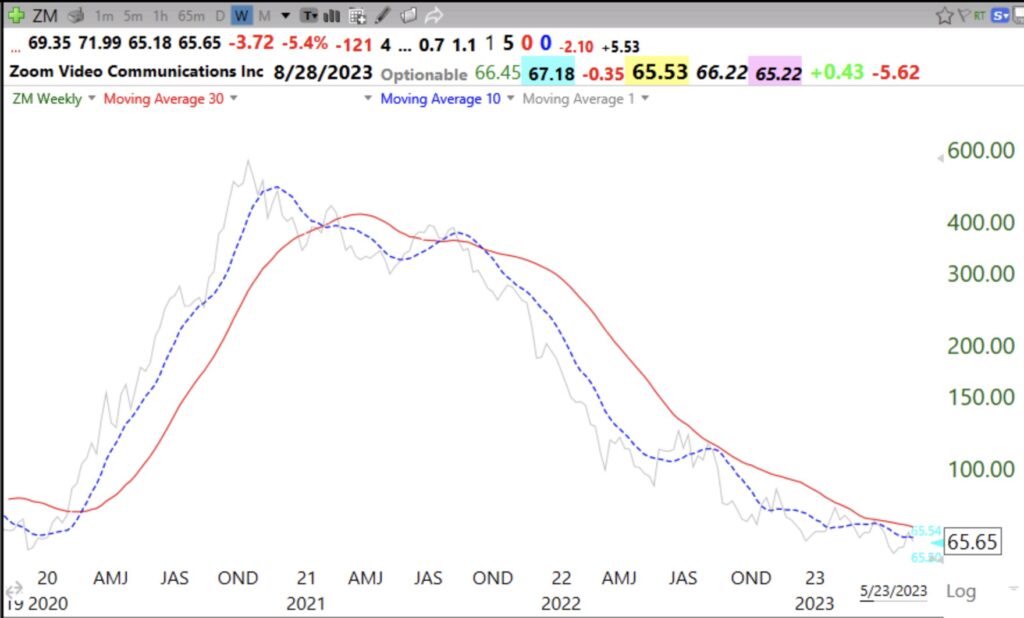
This pattern works for individual stocks too.

On the way up and then down.
 

Leave a Reply

This site uses Akismet to reduce spam. Learn how your comment data is processed.