I tweeted a few days ago about my analysis of new highs and lows and how it helped me to exit the market in November, 2021. I received many questions about how I compute these statistics and thought I would show you. I have created a New High and a New Low column in TC2000, my favorite technical analysis software. I then select the watchlist stored in TC2000 for all US stocks and sort it by each of the columns separately. When I sort by the New High column, all stocks with a check are at a new high. I scroll down to the end of the stocks with checks, click on it and then can see to the left its number. That tells me the number of new highs. I repeat the process for new lows.
The trick is to create a set of conditions that filter for new highs. You cannot use a TCD2000 PCF (personal formula) because any stocks that did not exist for the period in the formula will result in a null result. For example, if you try to calculate a new high in the past 250 days, any stock that did not have valid closes for the past 250 days would result in a null result. To get around this limitation you have to use the built in TC2000 conditions, Price New High and Price New Low.
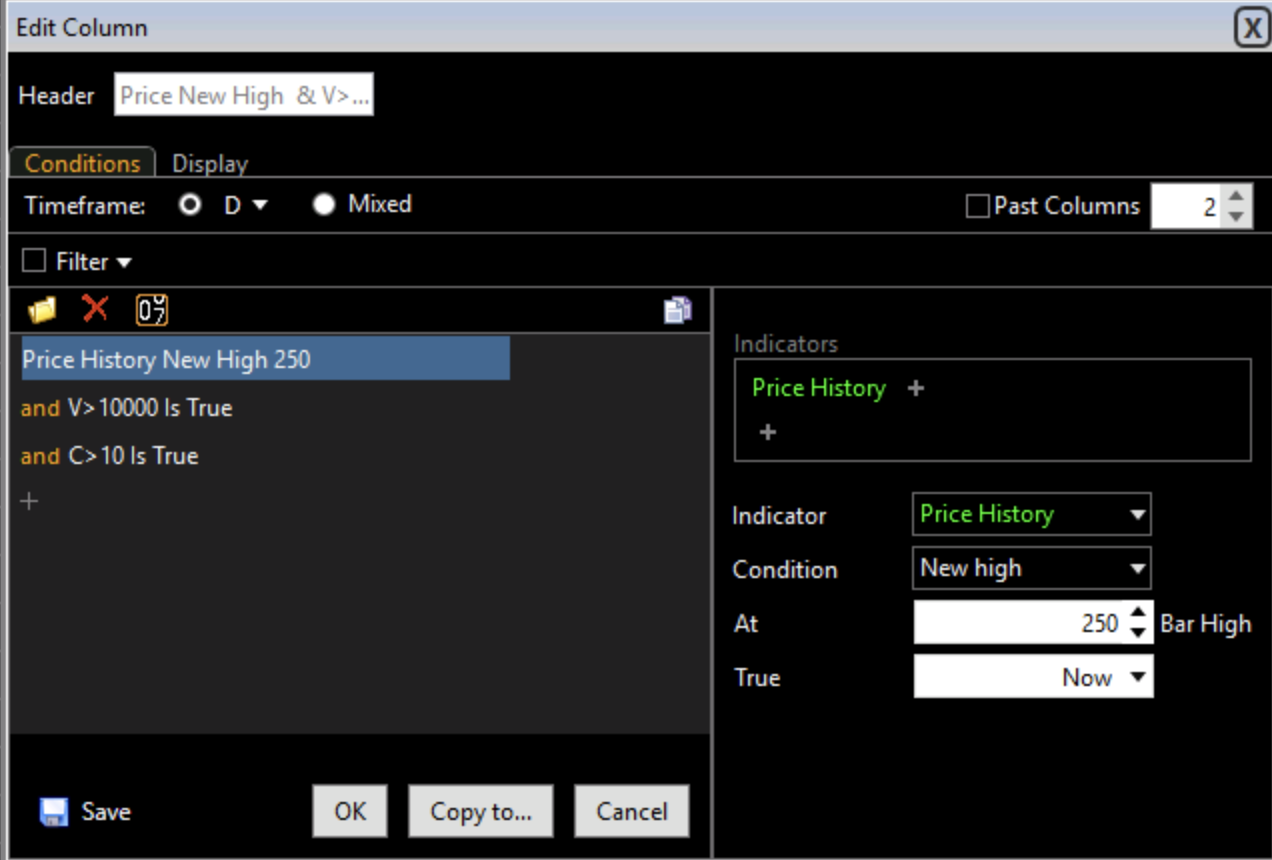
Right click in a column in your watchlist and select Insert, true/false and then new condition. Then search on price new high and once added and the parameters are set, write 2 formulas. Here are the filter conditions I use. First set all conditions to days. Price History New High set to 250 bars and now. Next write the formula: V>10000 to eliminate stocks with very low trading volume. Write the formula C>10 to eliminate stocks closing less than $10. You can use alternative numbers if you wish.
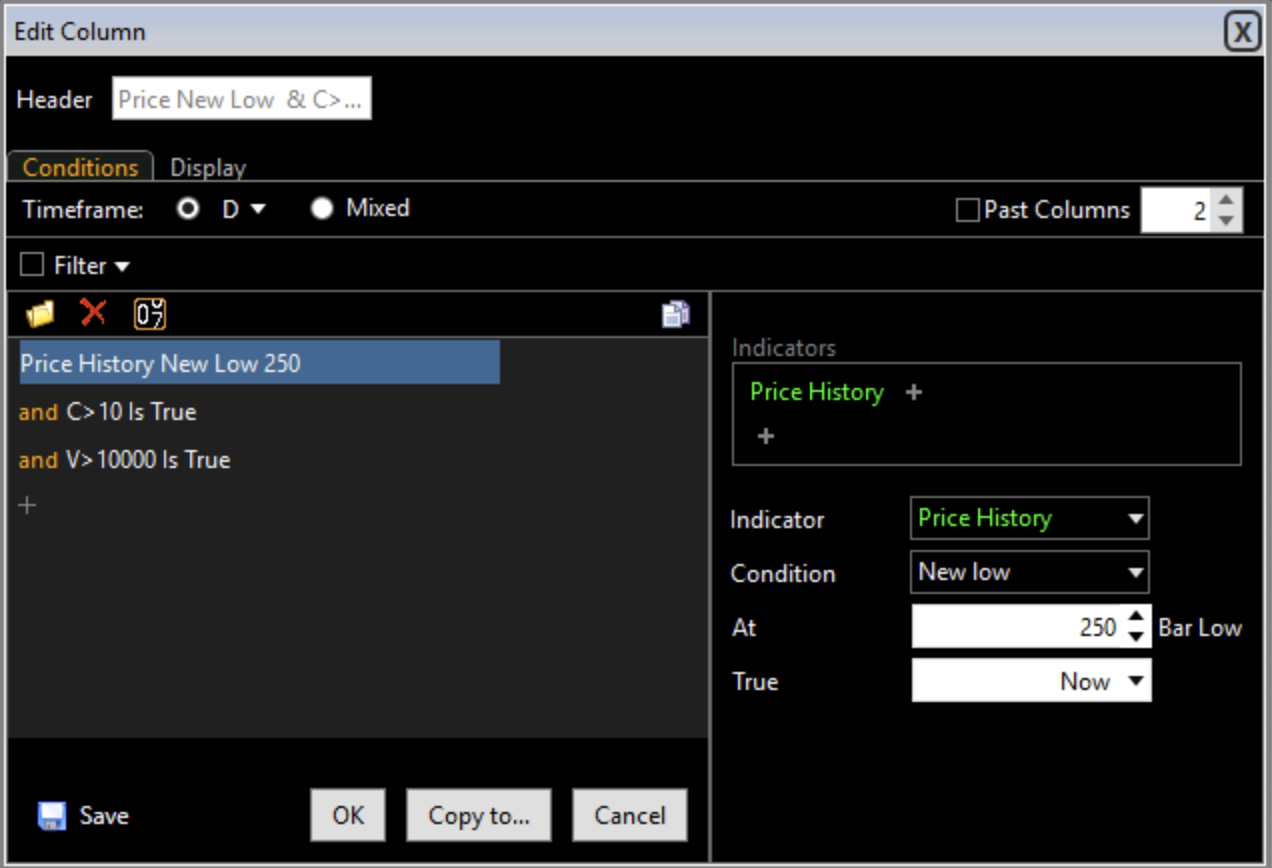
Once you have entered these conditions, select the Display tab. Then choose check and any color you want the check to be. The default setting for updating is manual, change it if you want it to update automatically. Create a second column retaining all filters except substitute Price New Low condition for the New High condition.
Once you have created these two columns, select the US stocks built in watchlist and then sort each column. There should be about 6486 stocks in this watchlist. On Friday, there were 207 new highs and 10 new lows.
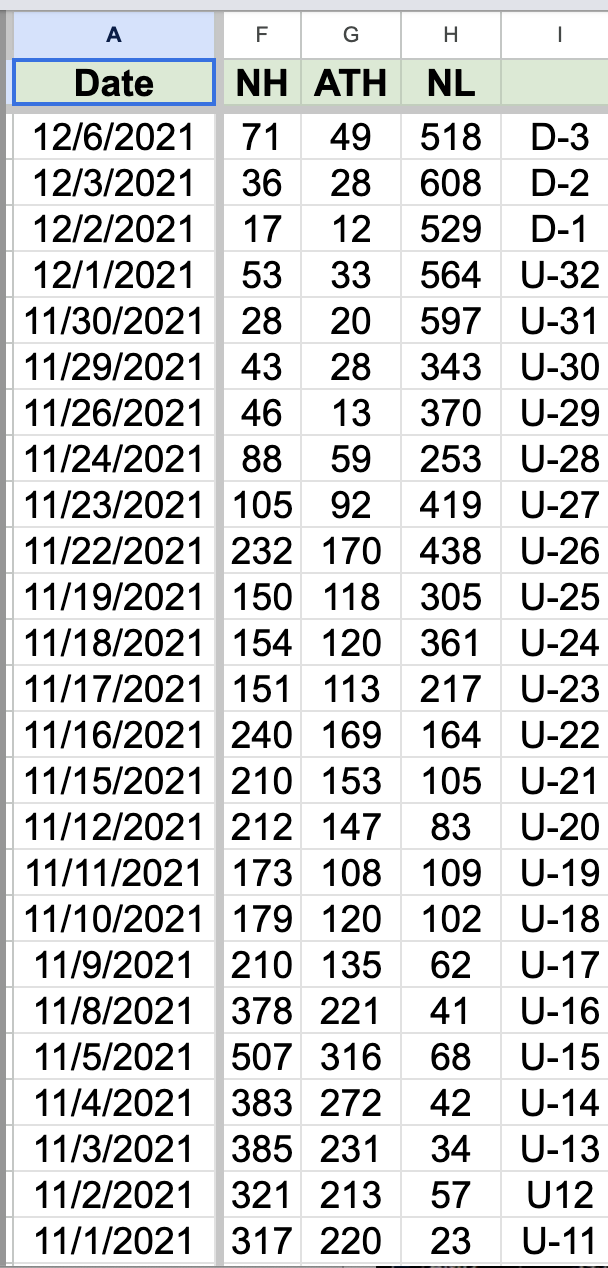
Every night after the close I calculate these and other statistics and add them to my spreadsheet. In November, 2021, I noticed that while QQQ was continuing its series of all-time highs, the number of new lows was surging. This factor, together with the knowledge that the markets had been red hot led me to exit the markets. It was a lucky call but when QQQ later entered a Stage 4 decline I was content to remain out of the market for over a year. Here is my spreadsheet from 11/2021. QQQ’s peak occurred on 11/22/2021, when there were 438 new lows. Column I shows my QQQ short term trend count. On11/22 it registered U-26, the 26th day of the short term up-trend, which I track in my daily blog.
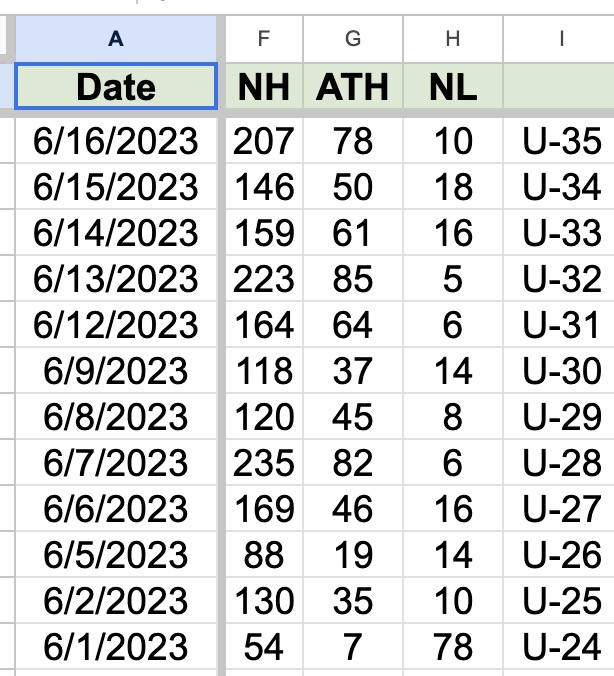
Some readers asked what the pattern of yearly highs and lows is now. Here it is. There are very few new lows. Column G shows the number of ATHs (all time highs). Note that on Friday there were 207 new highs, 10 new lows and 78 at an all-time high. Friday was the 35th day in the QQQ short term up-trend.
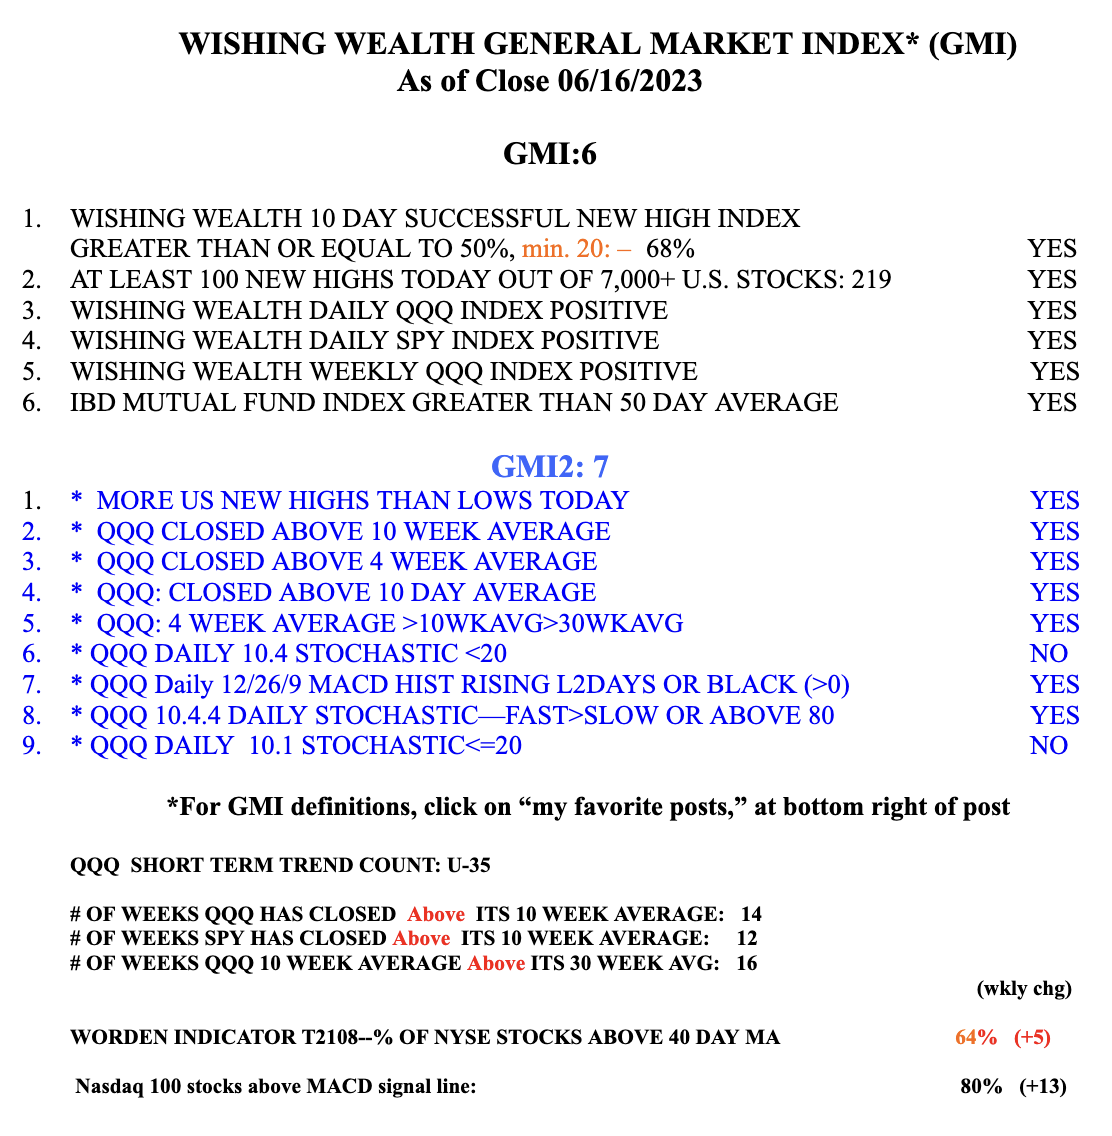
The GMI remains Green and registers 6 (of 6).
Awesome analysis. Can you apply to other historical turning points either buy or sells? How far back do these signals go in history? Thanks so much for your analysis.
How do you calculate short term uptrend in qqq?
Generous of you to share your knowledge and experiences.
You will just have to watch my site to get the current count.
TY
U just have to watch my site.
I have not done a historical analysis. As John Boik, @monsterstocks1.