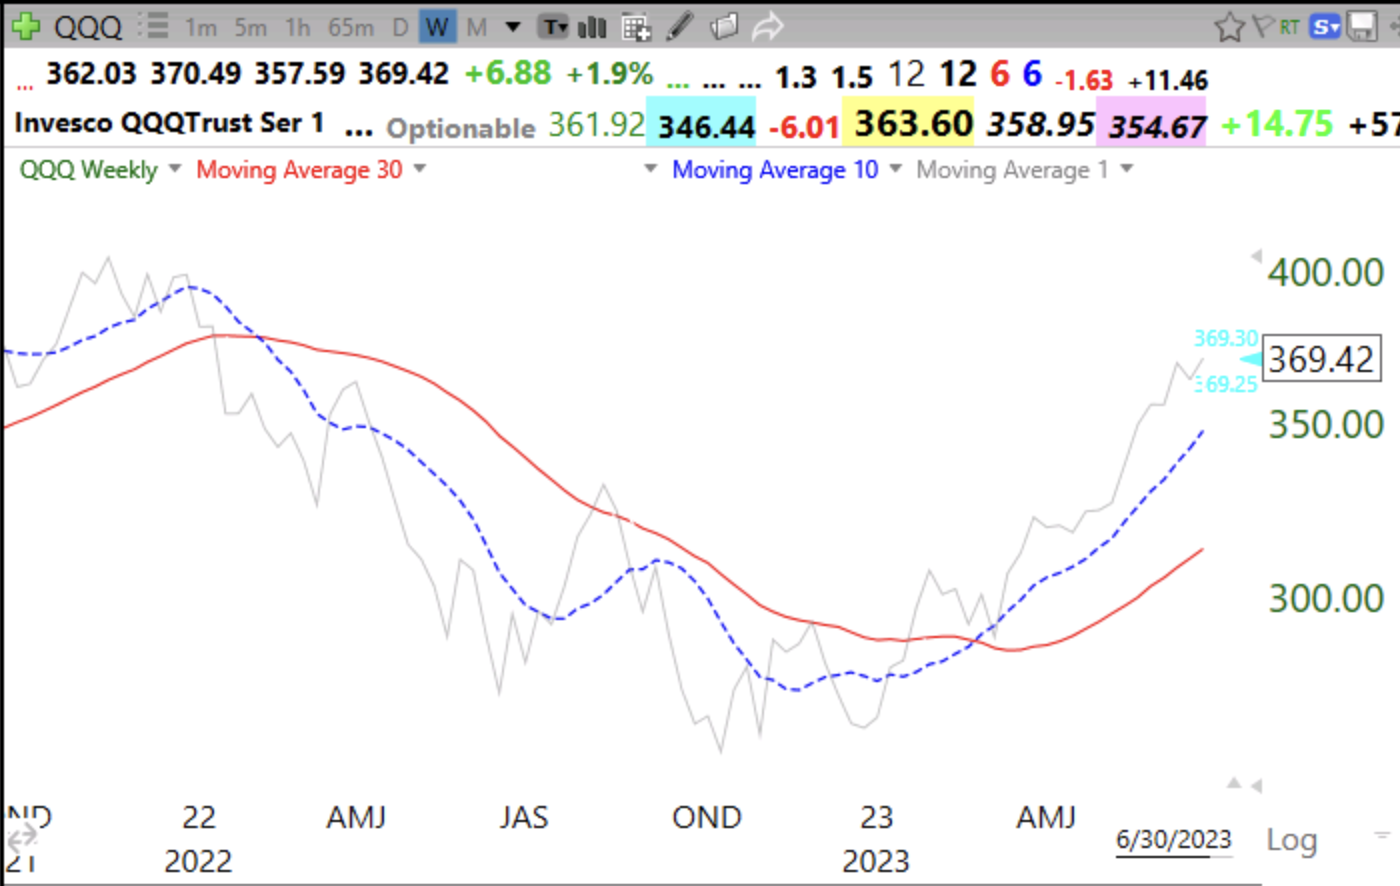
This weekly chart shows the 10 week average (dotted line) and the 30 week average (red solid line). The gray line is the weekly close. When the 10 week average crosses above the 30 wk and the 30 wk starts rising we are in a new bull market. The early sign of a possible down turn will be a weekly close back below the 30 week average. These signals have helped me to be in rising markets and out of declining markets since 2000.
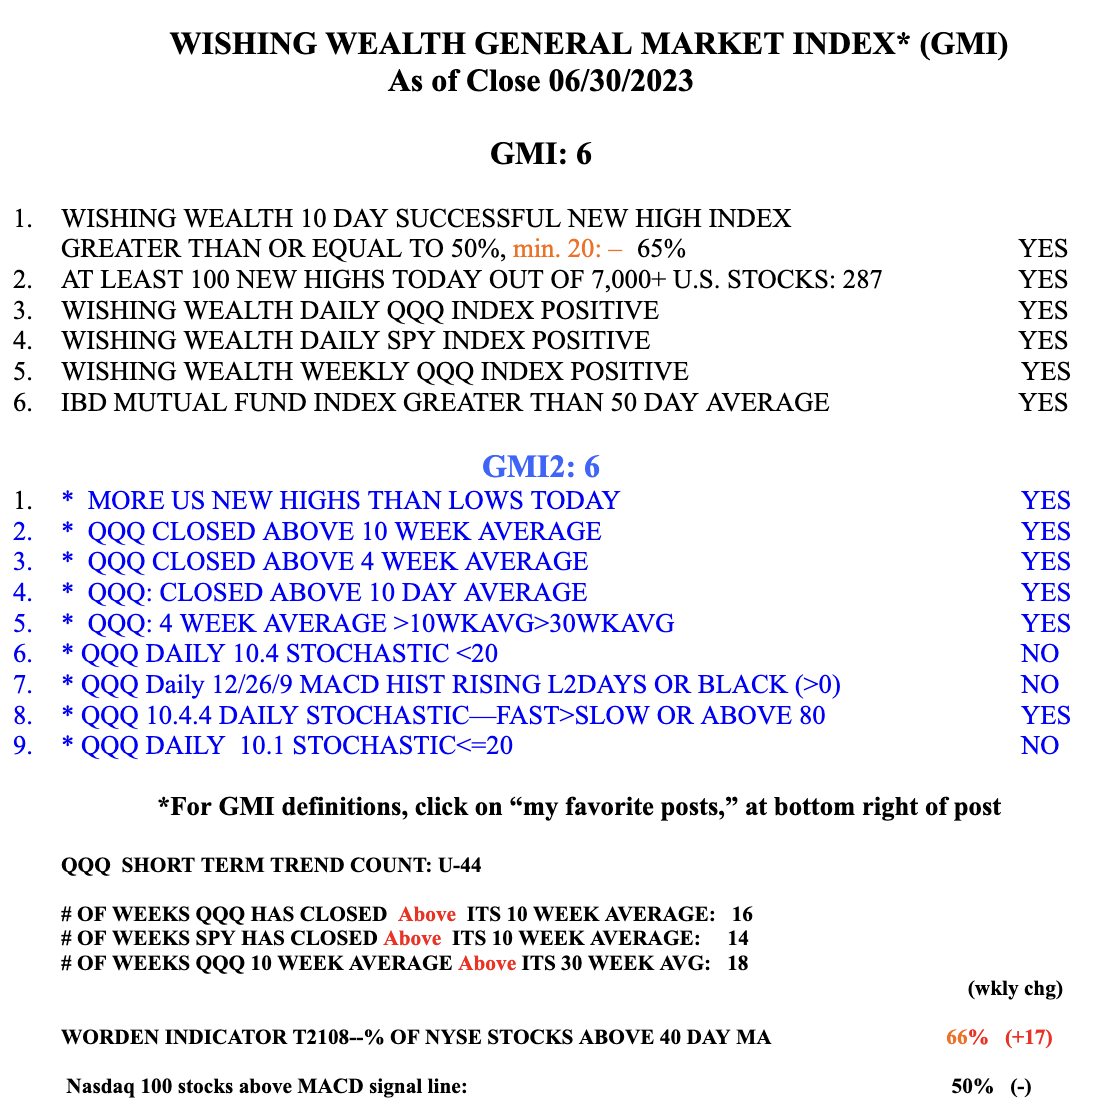
Meanwhile the GMI is Green and registers 6 (of 6). It turned green on 3/30/2023. The 10 week crossed above the 30 week earlier, on 3/3/2023.