I am on the defense in my trading account. I hold some SQQQ, a 3X leveraged ETF which is designed to rise three times as much as QQQ falls. It is the opposite of TQQQ which rises three times as much as QQQ rises. I noted last post that in the past few years 40% of the new QQQ short term down-trends have ended within 5 days, so I must be nimble and act fast if the current down-trend should end this week.
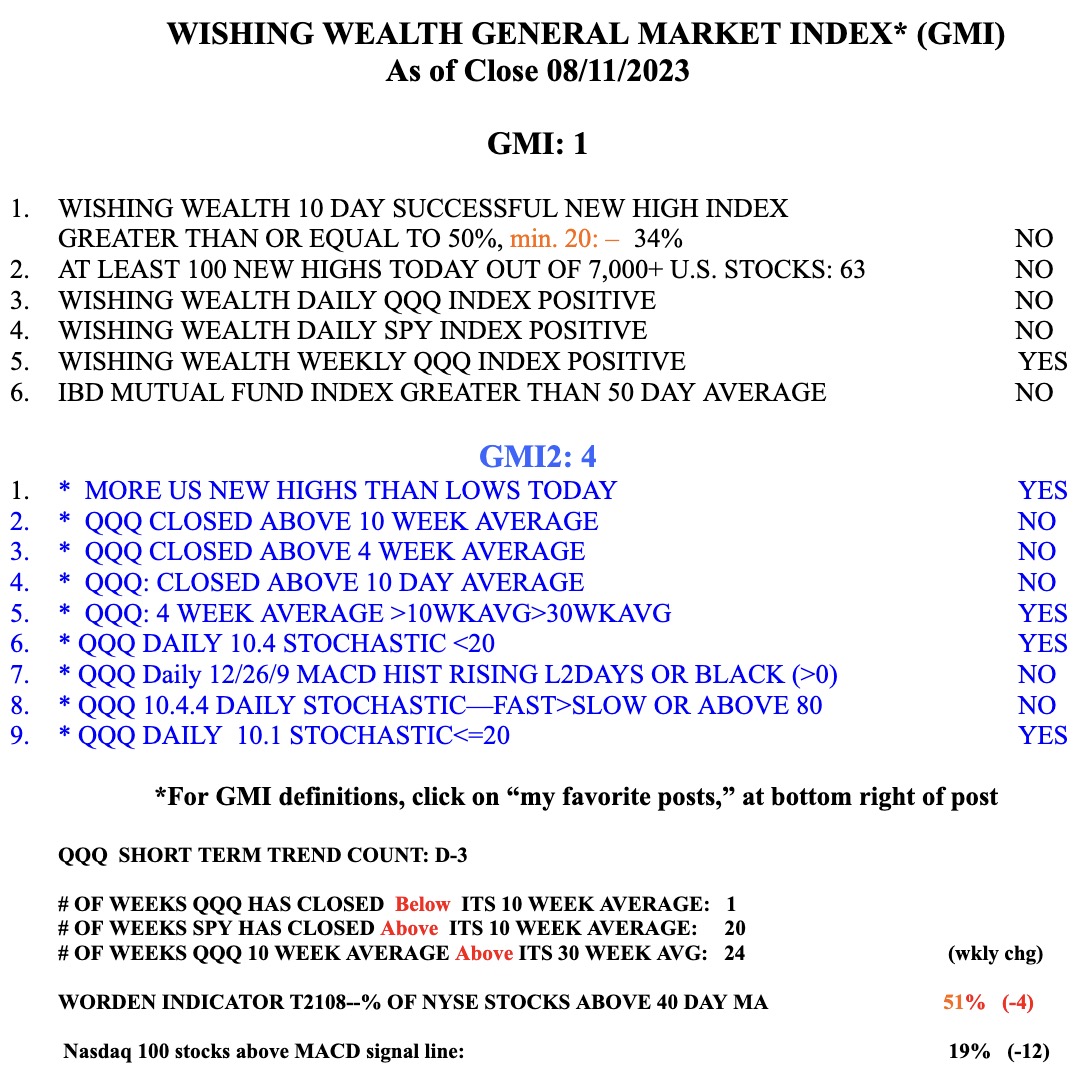
It is disconcerting that the GMI has now turned Red. While QQQ remains in a Stage 2 up-trend, the GMI is telling me to be on the defensive. Breakouts will be more likely to fail. And with fewer than 100 stocks hitting new highs each day, betting on stocks at new highs to continue rising is a difficult game to play right now. The strength of new highs is also measured by the first component in the GMI table. Only 34% of the stocks that hit a new high 10 days ago closed higher Friday than they closed 10 days earlier. QQQ has now closed below its 10 week average, a significant sign of technical weakness. The last time this occurred was last March near the beginning of the new up-trend. Unless QQQ should close below its 30 week average I remain invested in my long term conservative accounts.
The 10:30 week chart below tells the story. The gray line plots the weekly closes. The red line is the 30 week average and the dotted line is the 10 week average. As long as the 10 week average is rising above the rising 30 week average it is a strong Stage 2 up-trend.
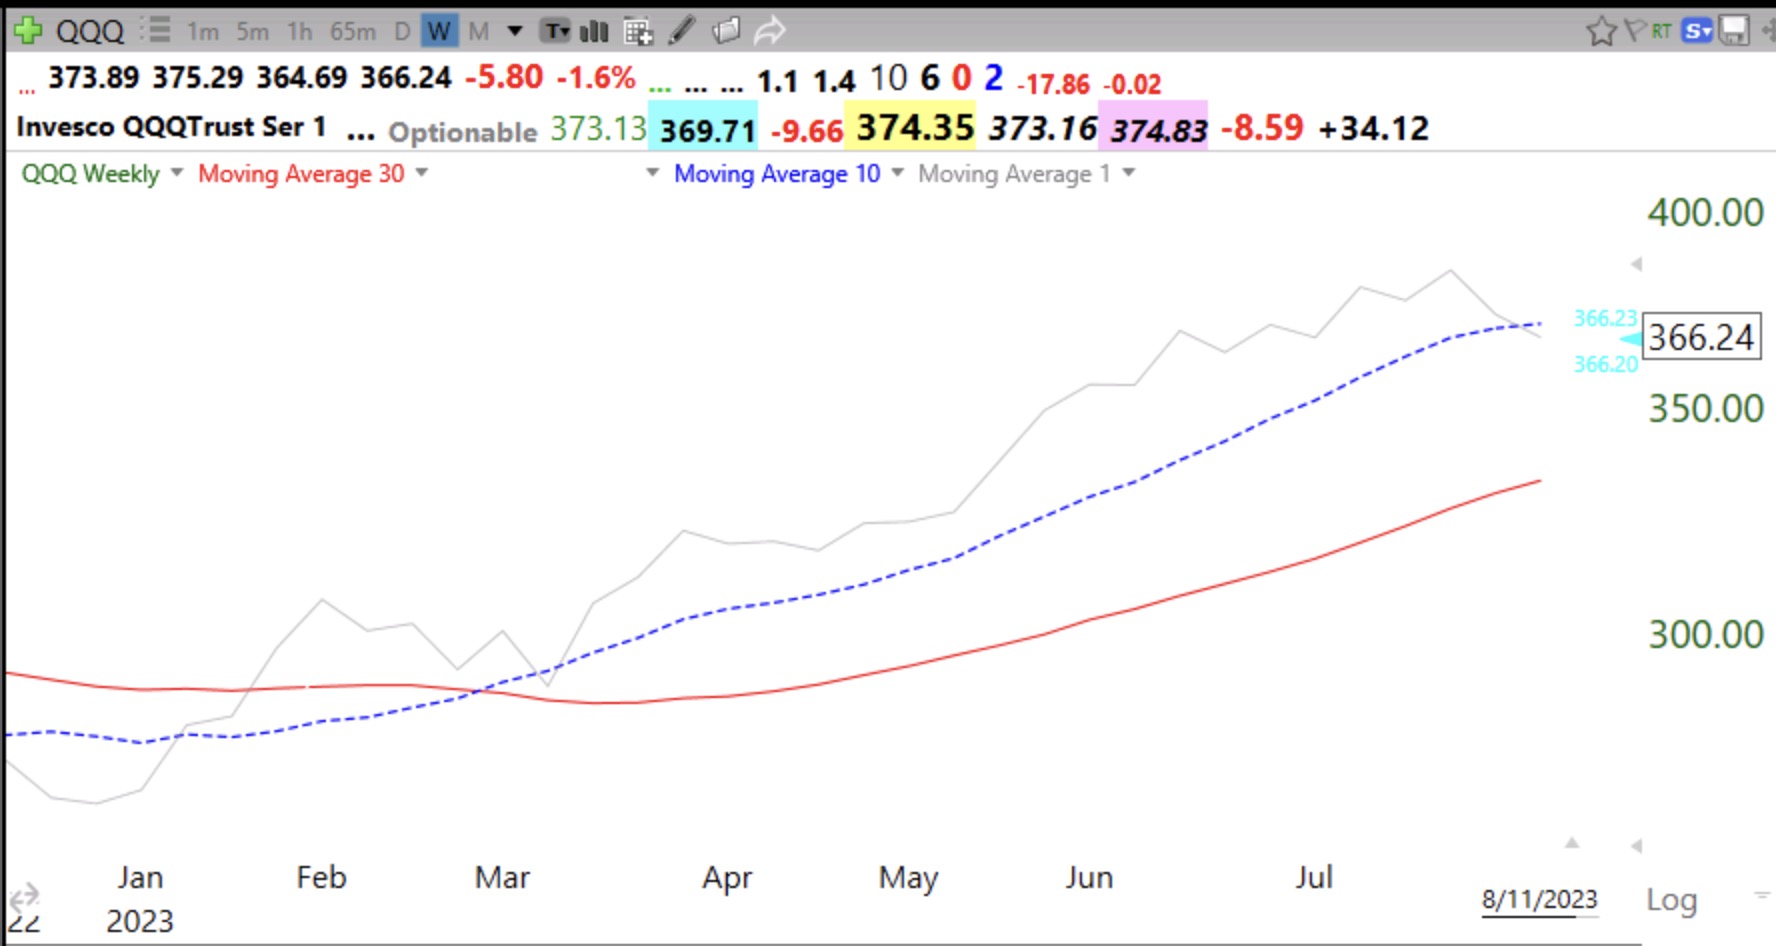
If QQQ should close below its 30 week average, the sole remaining positive component of the GMI would turn negative and the GMI=0. I exit the market when that happens. Note that the two stochastics indicators in the GMI2 are <20. QQQ is very oversold short term and a bounce could occur soon. I do not follow the GMI2 total at all. The GMI2 table is there just to remind me to record its components after each market close. The GMI2 components are not all positively correlated with the market. Note that SPY and DIA remain above their 10 week averages. The tech stocks in QQQ are the source of its weakness.