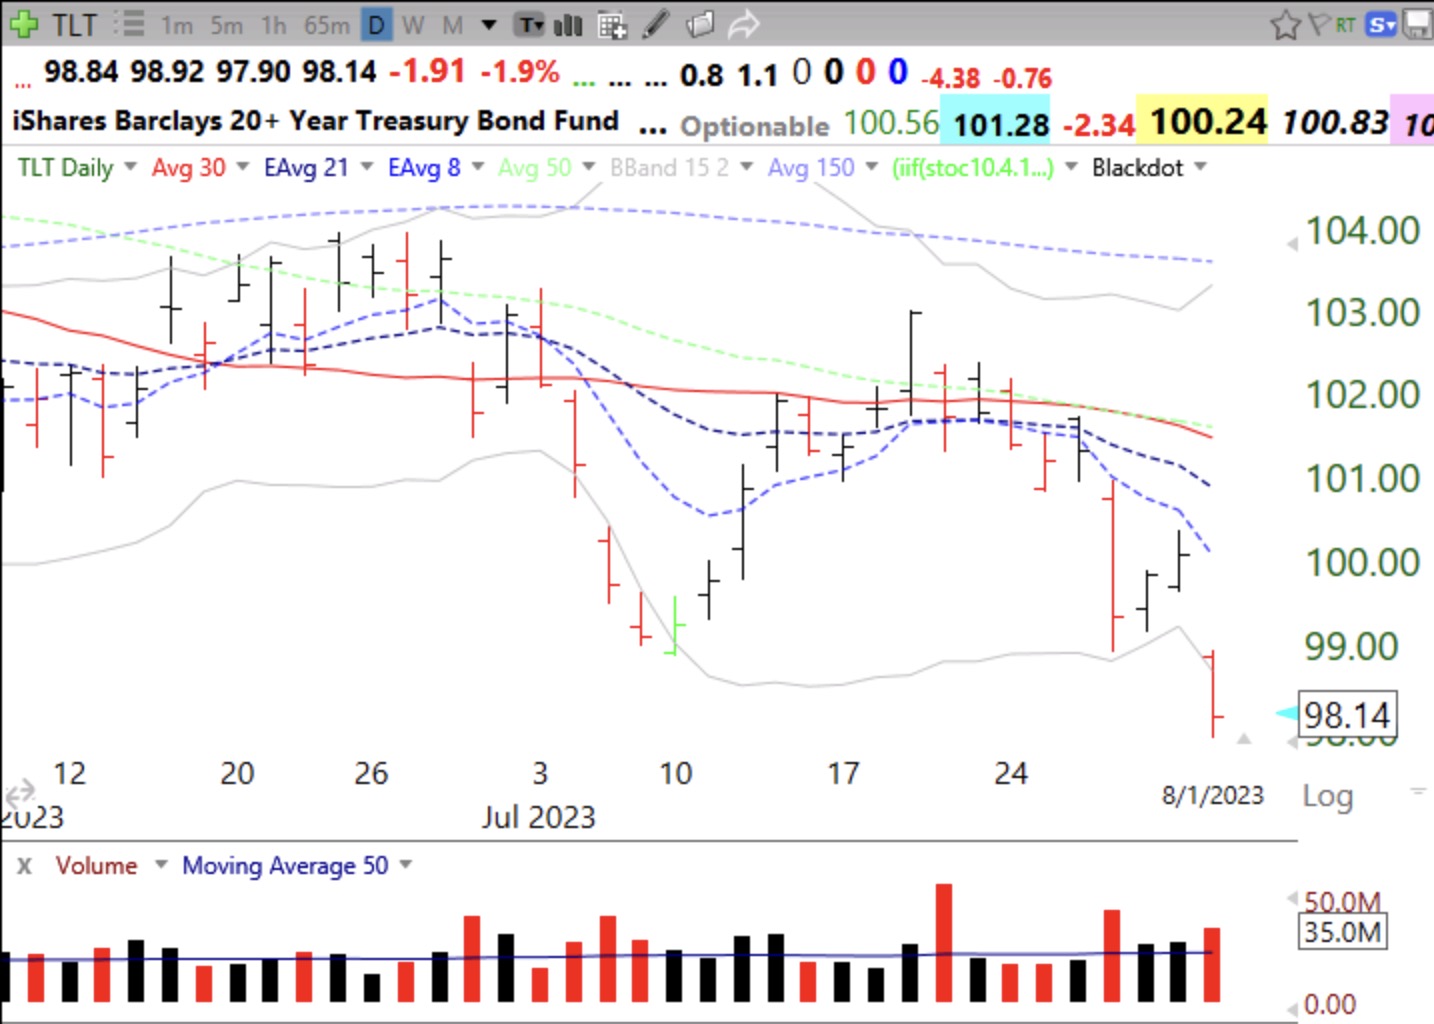
As bonds fall rates go up. Something is off. Could this be related to the Fitch downgrade? Look at the red spikes. The market cannot fight rising rates. The QQQ short term up-trend, at 65 days is getting old. Most end before this, see chart below for 2006-2019. The end of a short term up-trend does not necessarily signal the beginning of a large down-trend, only a short term down-trend.
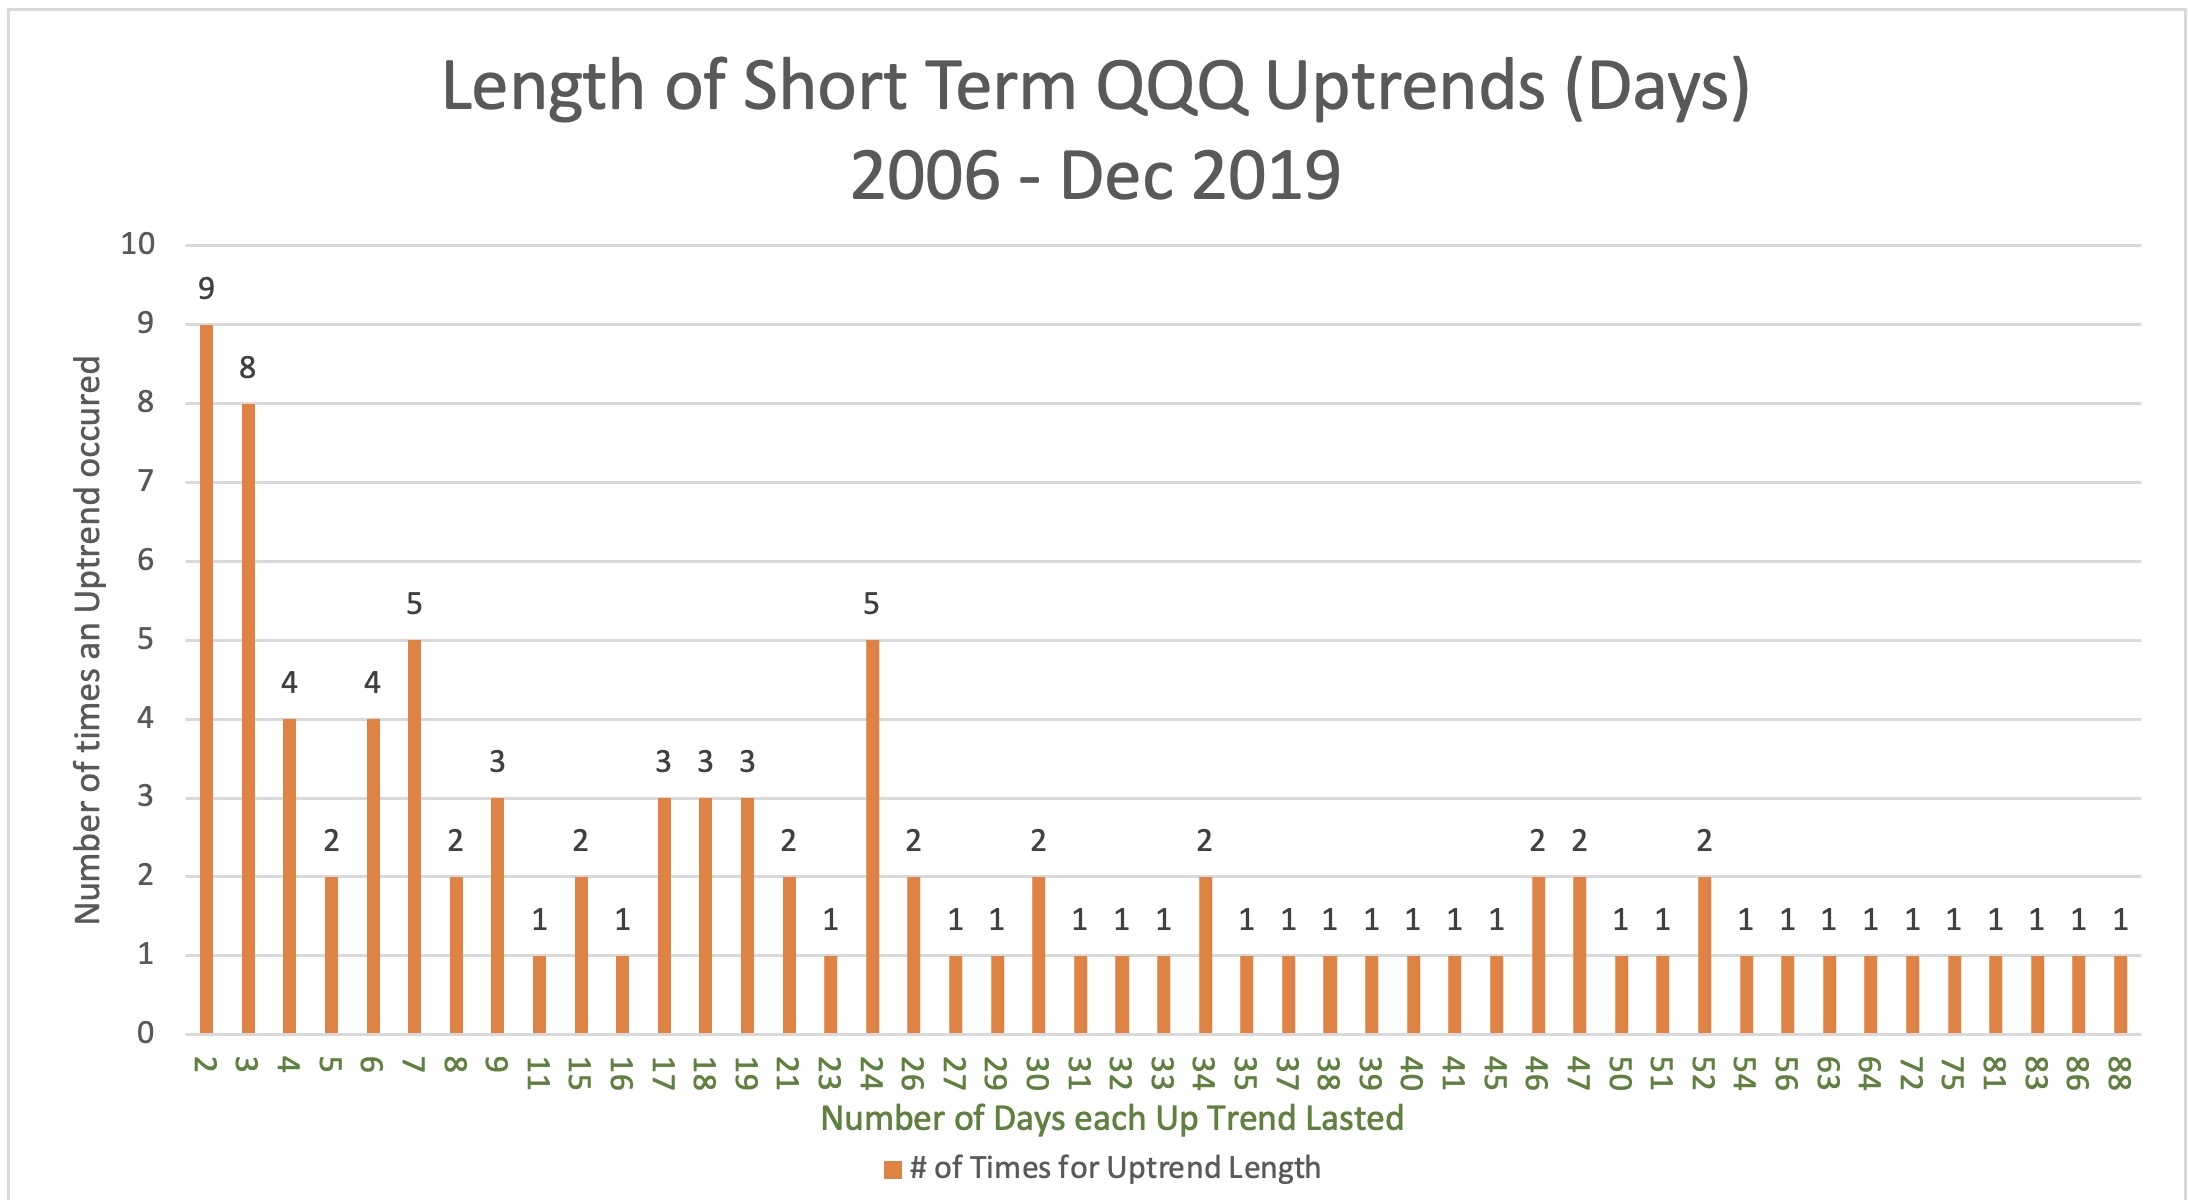
I don’t get much from the QQQ chart. For example an uptrend that lasted 24 days had 5 uptrend occurrences. What does that mean? Did things go down during the 24 days and then have 5 times they went up again before the uptrend was over? What is the lesson that these uptrends within uptrends is showing?
Jere, I’m sure it means there were 5 times that a $QQQ uptrend last 24 days, then failed. Nothing about the action during each of those uptrends. 65 days is very rare, caution.
Can we please see the short term uptends on a chart to visualise the entries and exits
Arnold what you said makes sense, but can we believe there were only 9 times an uptrend lasted only 2 days?