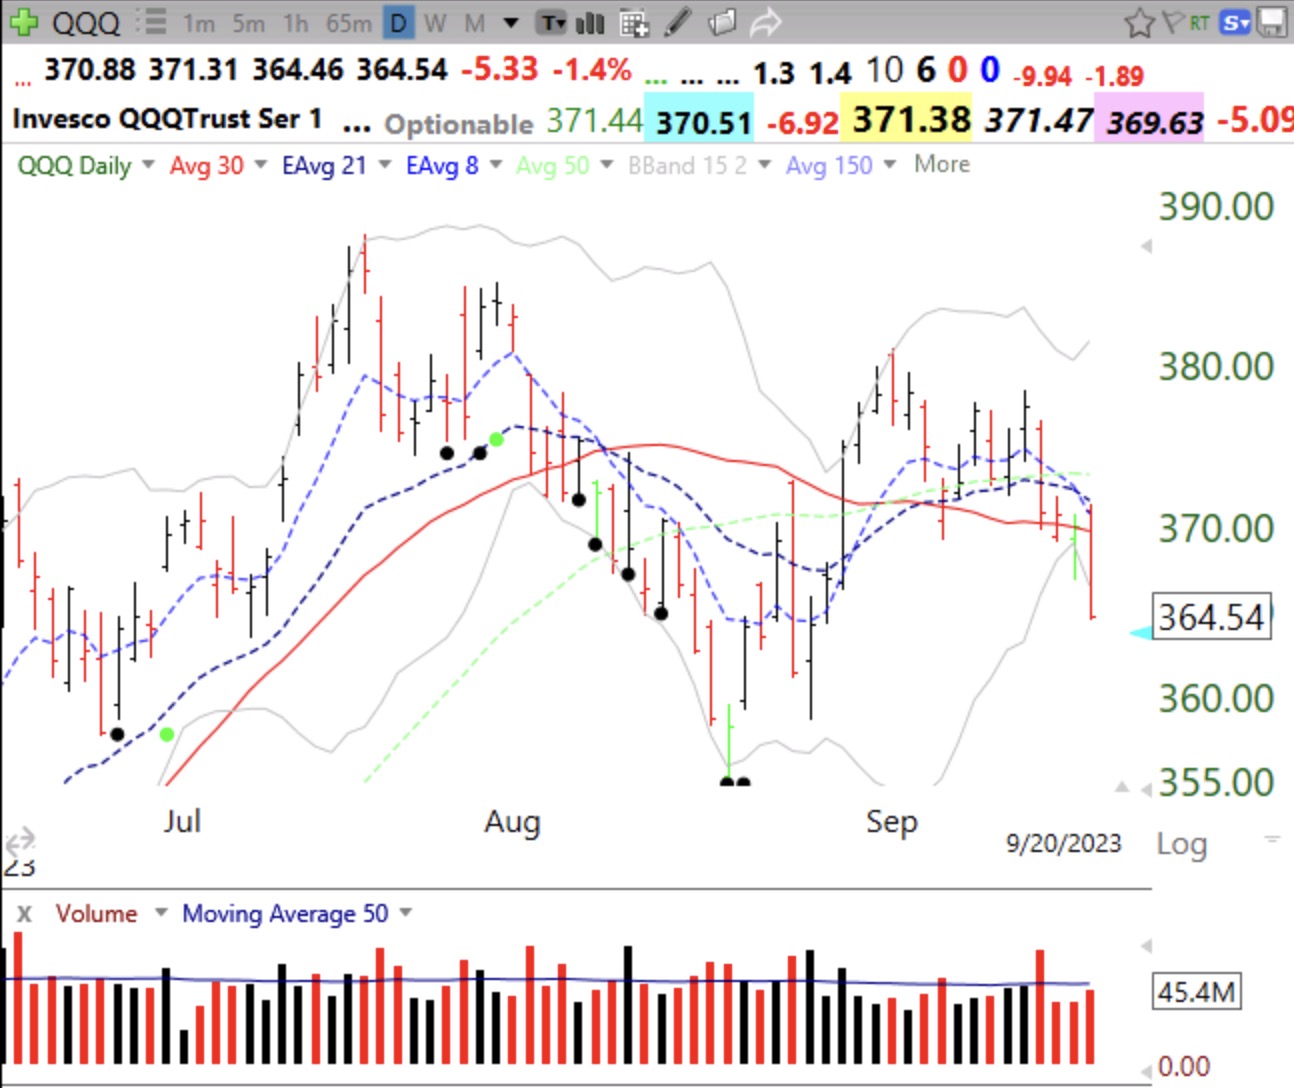
I am concerned that the put/call ratio is only .91. There is not enough fear in this market to turn it around. The chart of QQQ is looking ominous. Short term support has not held. I am mainly in cash with some $TBIL in my trading account.
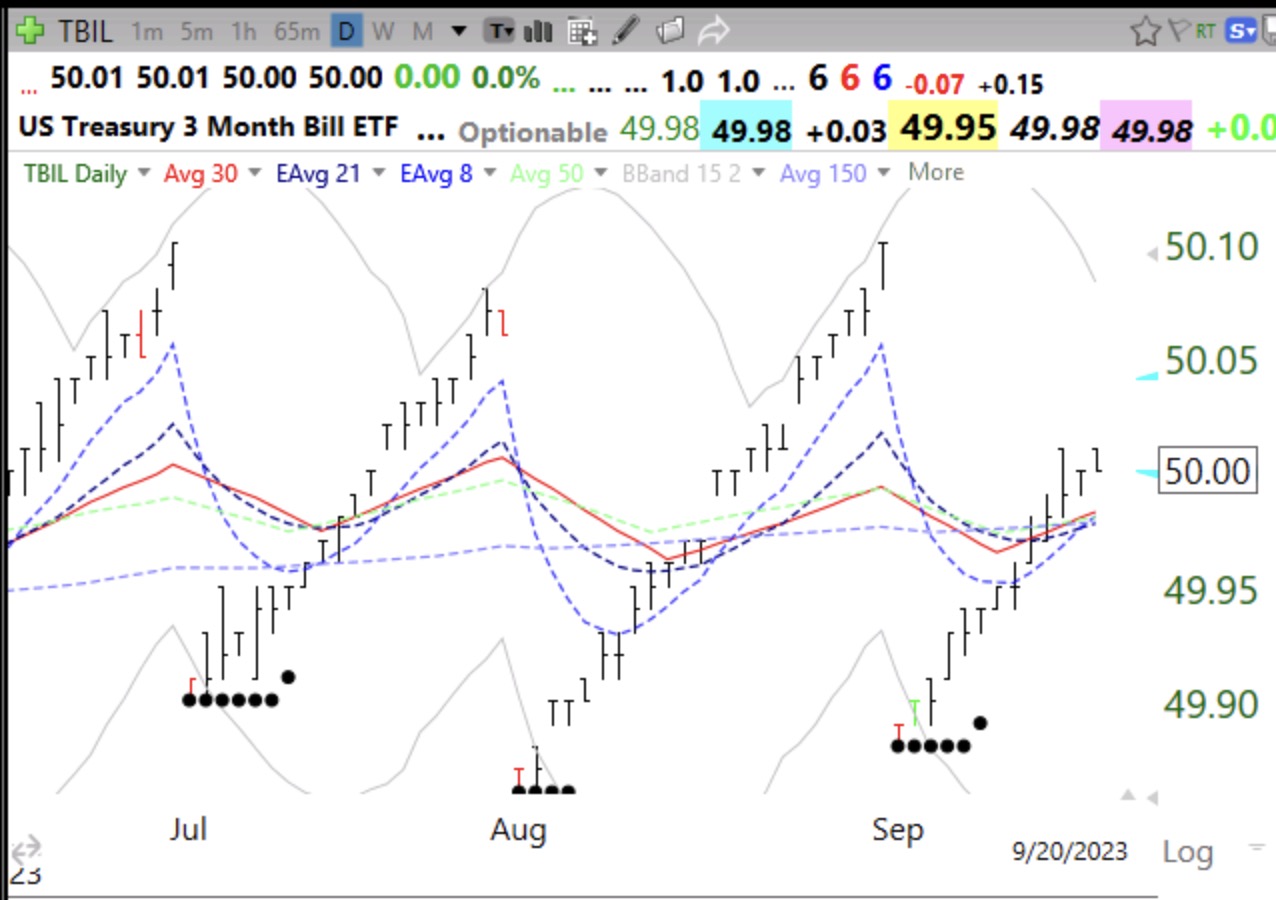
TBIL is an ETF that invests in short term treasuries. It pays a dividend monthly, which explains this unique daily chart. (TBIL is reduced by each dividend payment.) I enjoy seeing the dividend payment credited to my account each month. Its yield is a little over 5%. Check it out.
I’m trading in and out of T-bills on Fidelity. Max annual rate is around 5.5%. No fees.
You can also look at SGOV, which is very similar to TBIL but a little larger market cap and lower commission, so the return over the last few months is slightly higher.