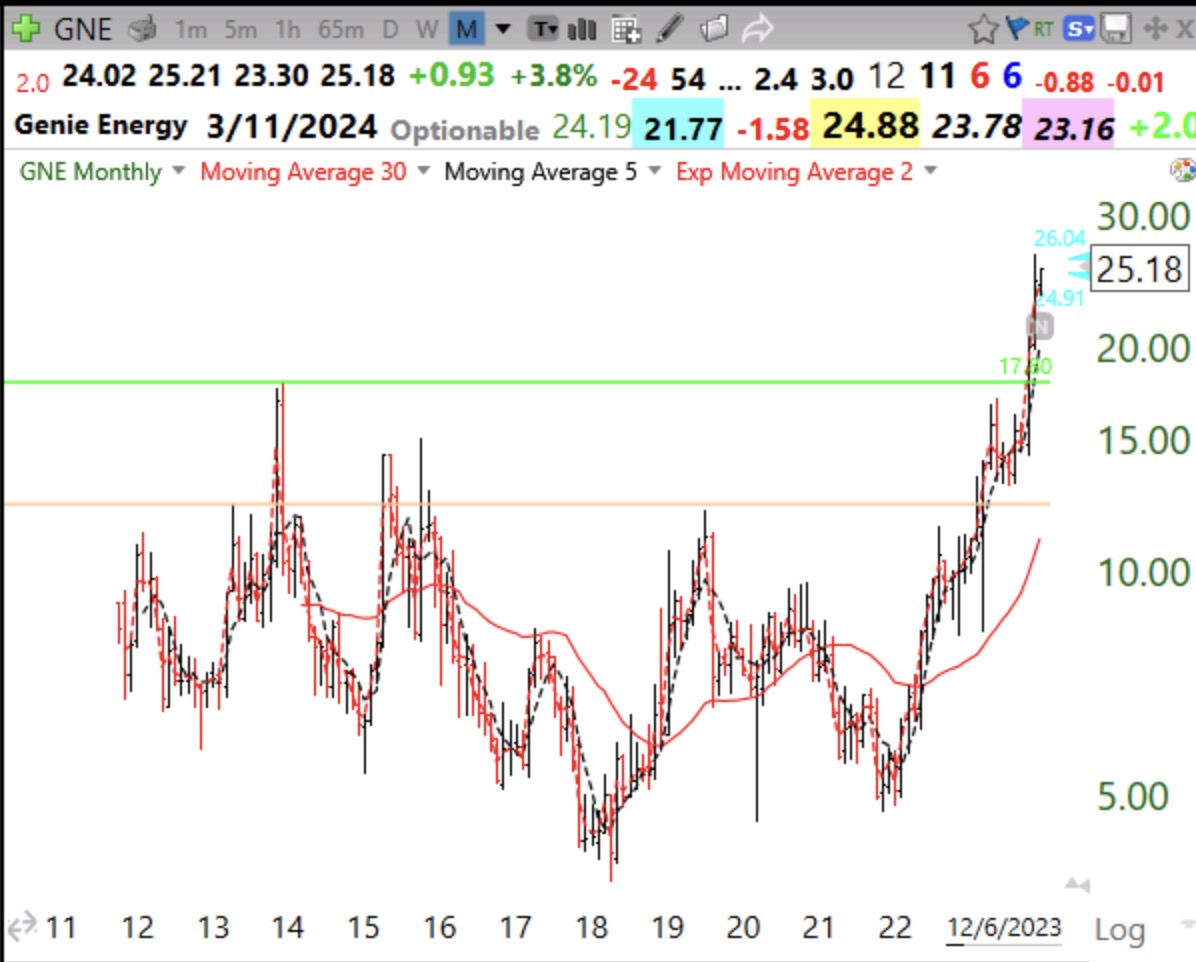
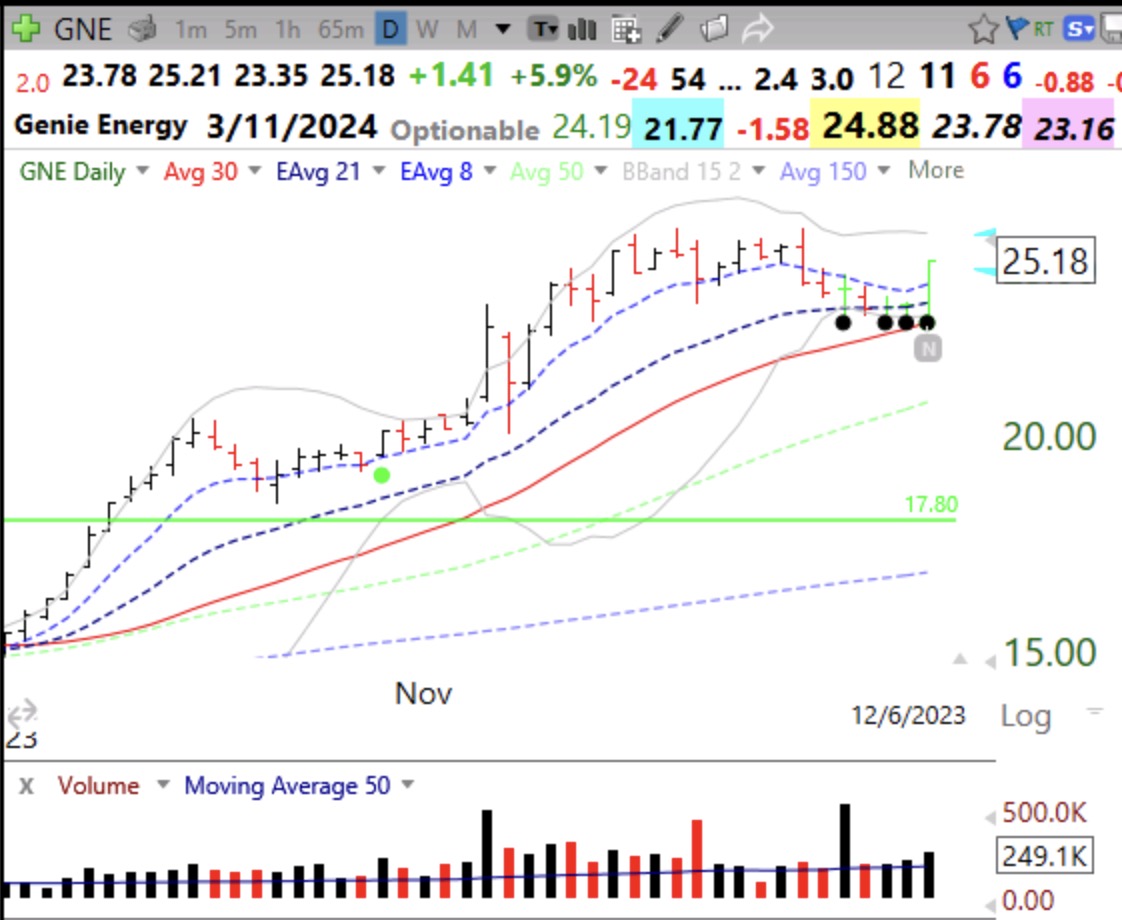
I have noticed that in a strong market, it is sometimes profitable to buy a stock that has reached an all-time high after a recent GLB, declined to oversold, and then turned up. I scan for such stocks with TC2000 and found GNE today. I bought a little GNE and placed my stop below the low of the bounce. If I am wrong, I get stopped out with a small loss. If I am correct, maybe GNE will go on to new highs? It has already tripled this year’s low. Maybe it will triple again?I had noticed GNE when it came up on my GLB (green line break-out) scan on October 11 (see GLB tracker to right). It since has held its green line (at 17.80) and advanced to as much as +43%. Now that it has bounced from oversold I couldn’t resist a small purchase. GNE has an IBD/MS Composite rating= 96 and RS=98. Note the black dots designating oversold. My late co-instructor, David McCandlish, built this tutorial showing people how to add the back and green dot signals to their charts using TC2000. His youtube page shows more tutorials he built for my class.
Here is its monthly chart.