While a new QQQ short term down-trend began on Friday, many end within 5 days. The fact that QQQ held its lower Bollinger Band, its 50 day and 10 week averages and had a black dot oversold bounce suggests that this bounce may hold. The key is to hold last week’s low. One thing going for the market is that first quarter earnings come out soon. However, now we are getting close to the “Sell in May and go away and comeback at Halloween” period. I am very defensive, holding mainly cash in my trading IRA and am waiting for Mr/Ms Market to define itself. If QQQ bounces, it may find resistance at the upper BB, around 449. If the Fed decides not to lower rates this year, the market could dive.

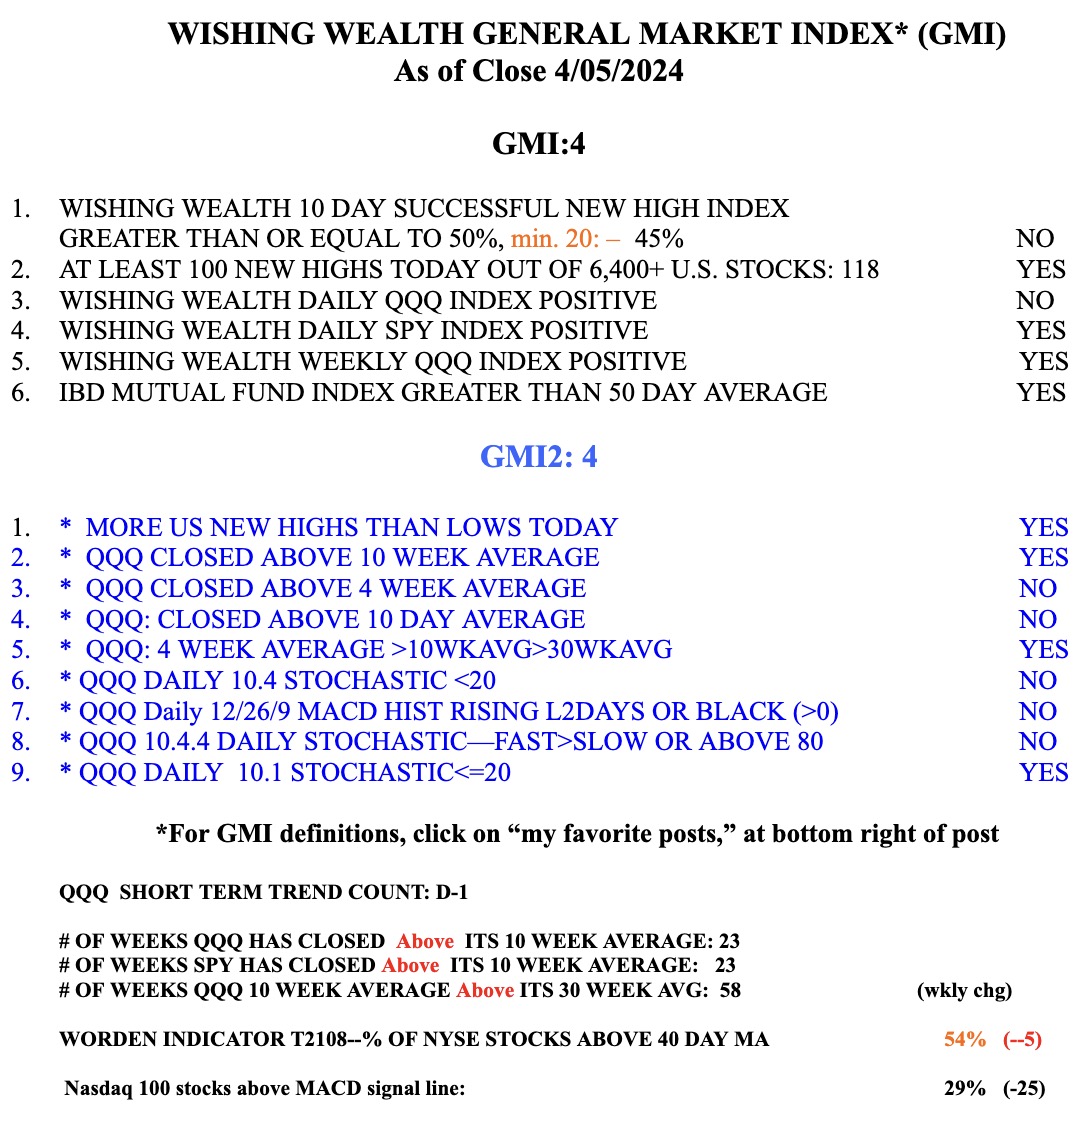
The GMI is now at 4 (of 6) but it is still on a Green signal.
How do you get the green and red dots on TC 2000? Thanks