The GMI remains at 3 and would have to be below 3 for 2 consecutive days to turn Red. The QQQ remains in short and longer term up-trends. End of quarter window dressing may begin tomorrow, as the futures look strong tonight. Then on to earnings and to “Sell in May.”
 Dr. Wish
71st day of $QQQ short term up-trend; $SPY RWB pattern over, mutual fund window dressing to bring rally?
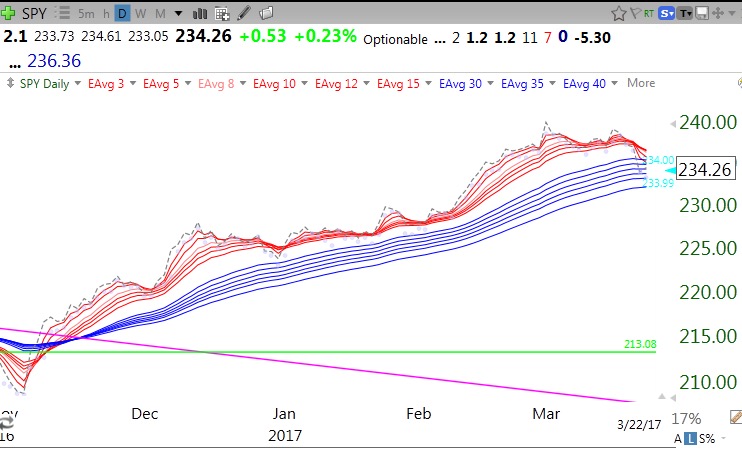
The QQQ short term up-trend has held. But note that the RWB pattern has ended for the SPY on this daily chart.This is the first time since the beginning of this rally in November that the RWB pattern has failed.
This is a close-up of the daily SPY. 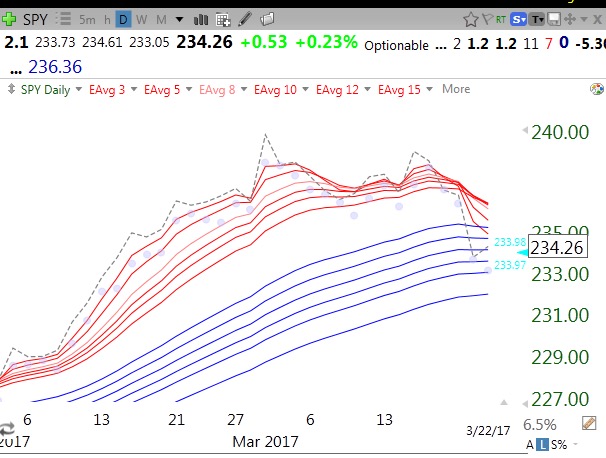
The SPY closed (dotted line) among the longer term averages (blue lines) and is leading the shorter averages (red lines) down to converge with them, making the white space in between them disappear. This is important technical weakness. If the RWB pattern does not reassert itself and a BWR pattern emerges, the decline will be larger and longer. I still suspect a snap back rally this week into the end of the quarter when the mutual funds dress up their quarterly portfolio reports with the strongest stocks. Or you can attribute it to the vote….
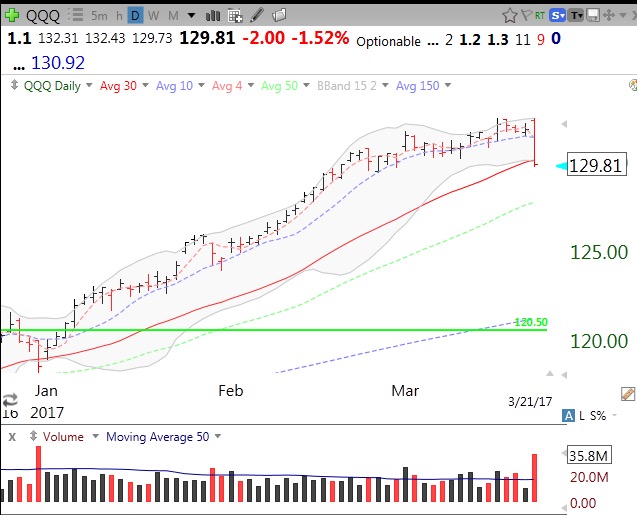
$QQQ short term up-trend could end today at 70 days; end of 1st quarter rally coming?
This modest decline has not reached over-sold levels yet. I went to cash and gold in my trading accounts yesterday. Plenty of time to get back on board when my stocks look strong again with RLCs=6. I would not be surprised if we get a sharp snap back rally into the end of the quarter mutual fund window dressing at the end of this week. Media pundits are becoming hysterical about this decline. Don’t people know that the market goes in both directions and this has been a rare uninterrupted advance? The longest QQQ short term up-trend (by my definition) since 2006 was 88 days and this one just turned 70. The put/call ratio is 1.04 and T2108 is 36. Daily 10.4 stochastics for QQQ=57. Bounces usually come after more extreme numbers than these. Meanwhile the RLC (red line count) for these symbols: QQQ=0, SPY=0, UUP=0 buy TLT=6, GLD=6. So stocks and dollar down but bonds and gold up. This daily chart of QQQ shows the high volume distribution day yesterday.