Nicolas Darvas attracts the fascination of many traders. Some of my readers have asked for more information about this amazing dancer-trader. While I know he is deceased, the best source on Darvas is the article (available for a small fee from the TIME magazine archive) that made him famous–Pas de Dough, May 25, 1959. If anyone else knows a better source about Darvas, please send it in. Also, check out my piece on his little known and rare final book, cited in my favorite posts link on Darvas, to the lower right.
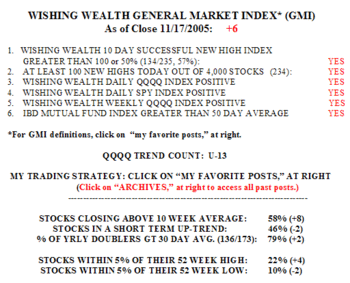
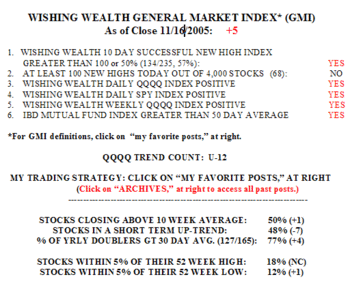
The GMI closed the week at +6. 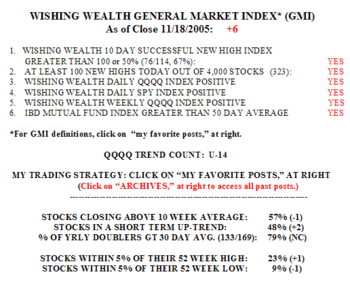 There were 323 new highs on Friday, the highest number since October 3. Between 62-64% of the stocks in the Nasdaq 100, S&P 500 and Dow 30 indexes rose on Friday. 23% of the 4,000 stocks in my universe are now within 5% of a 52 week high, compared to 9% near a new low. Friday was the fourteenth day (U-14) of the QQQQ up-trend. Since this up-trend began on November 1, the QQQQ has risen +6.6%. During this period, 81% of the 100 stocks in the Nasdaq 100 have advanced. This again shows that if we traded with the up-trend in the QQQQ average, we had an 81% chance of having a profit. The top ten gainers during this period are: LVLT (+40.8%), MRVL (+25%), AMZN (+18.9%); FAST (+17.7%), ATYT (+16.9%), QCOM (+16.3%), WYNN (+16.1%), INTU (+15.9%)MLNM (+15.4%) and GILD (+15.3%). I hope you owned some of these. 33 of the Nasdaq 100 stocks have gained 10% or more since this up-trend began.
The WPM shows improvement in all indexes, but the S&P small cap. 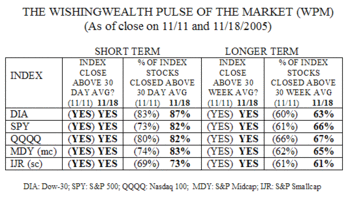 All five indexes are above their 30 day and 30 week averages. But 82% or more of the component stocks in all these indexes but the small cap are above their 30 day averages. In contrast, only 73% of small cap stocks are in a short term up-trend. The small cap stocks are also least likely to be above their 30 week averages (61%). Thus, while most stocks are participating in this up-trend, the small caps are laggards, for now.
Among the stocks that hit a new high Friday, have strong recent quarterly earnings and are up at least 60% in the past year are: GOOG, PLLL, CUTR, UBB, ISRG, IRIS, MDR, HUBG, MRVL, HOLX, RES, GHL, SUPX, CX, KYPH, CDIS,GOL and CERN. (I own some of these.) These stocks are prime rockets for further research and consideration.
How have you used this site to inform your trading? Can you send me some experiences I can post for others (anonymously, with your prior permission)? Please send your pearls of Wishdom to me at: silentknight@wishingwealthblog.com.
