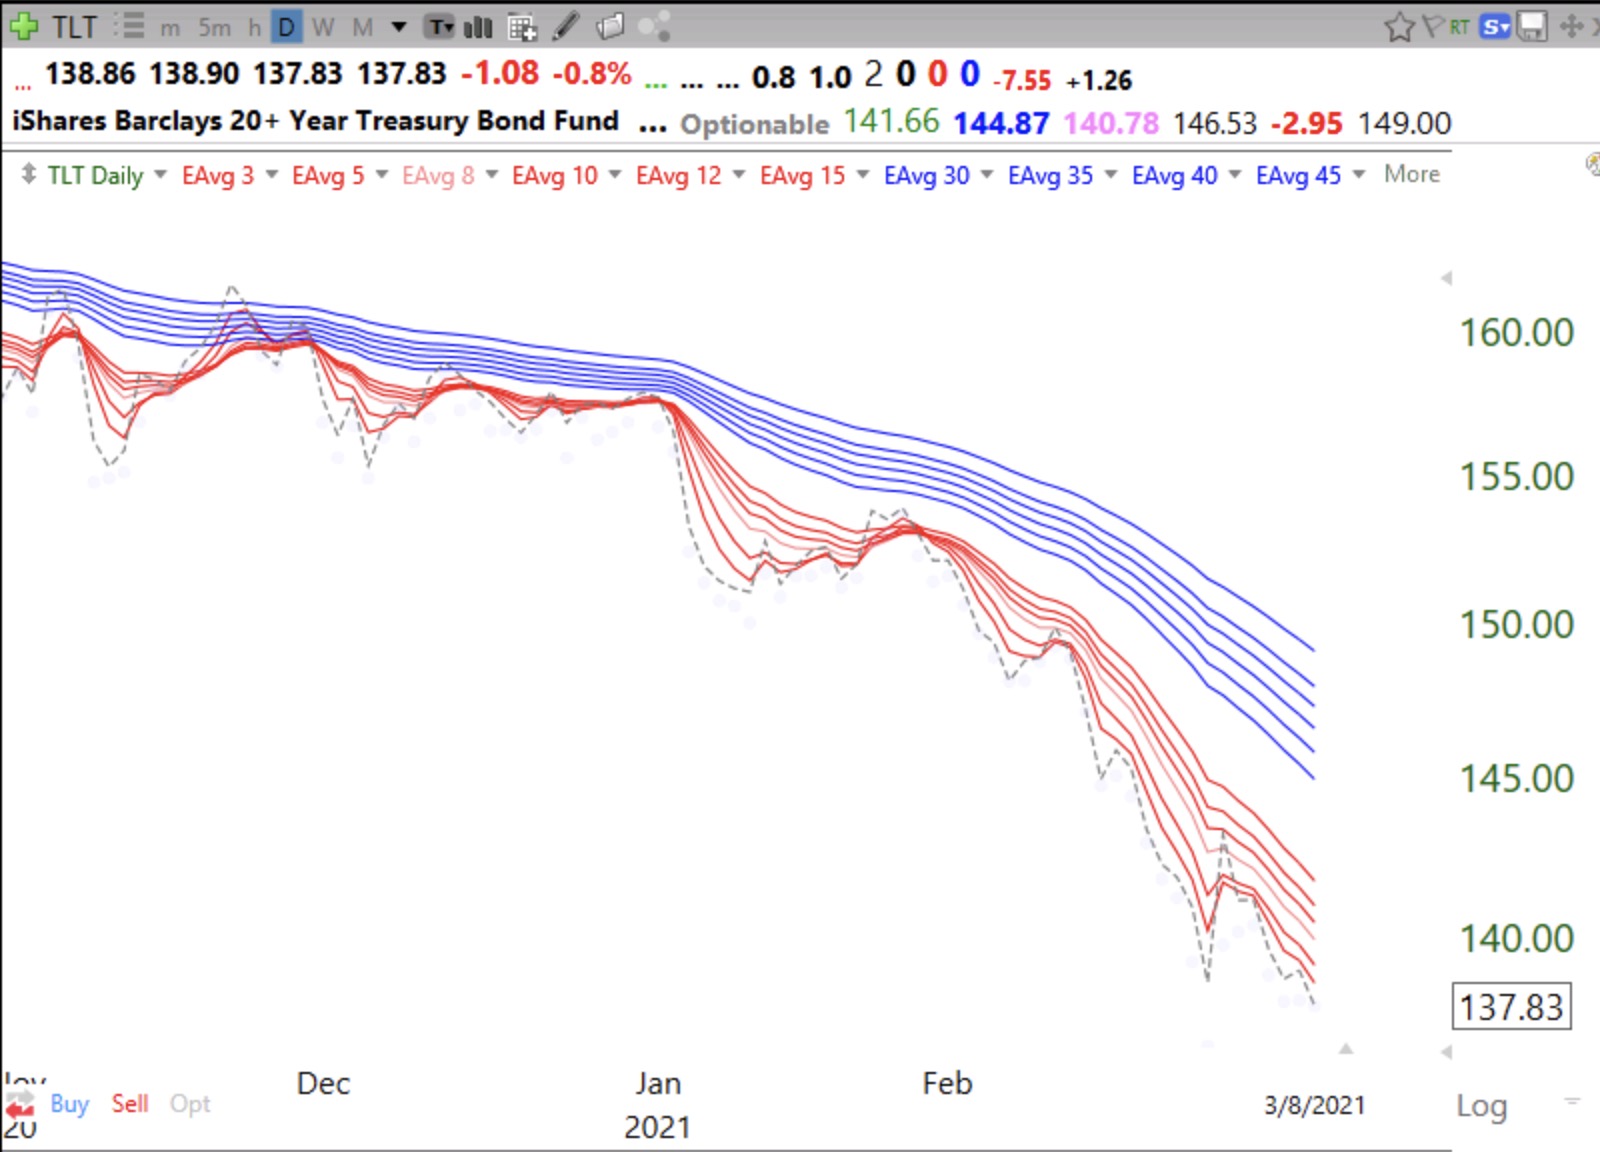
As bonds collapse, already in daily BWR down-trend and bringing higher interest rates
Stock Market Technical Indicators & Analysis
As bonds collapse, already in daily BWR down-trend and bringing higher interest rates
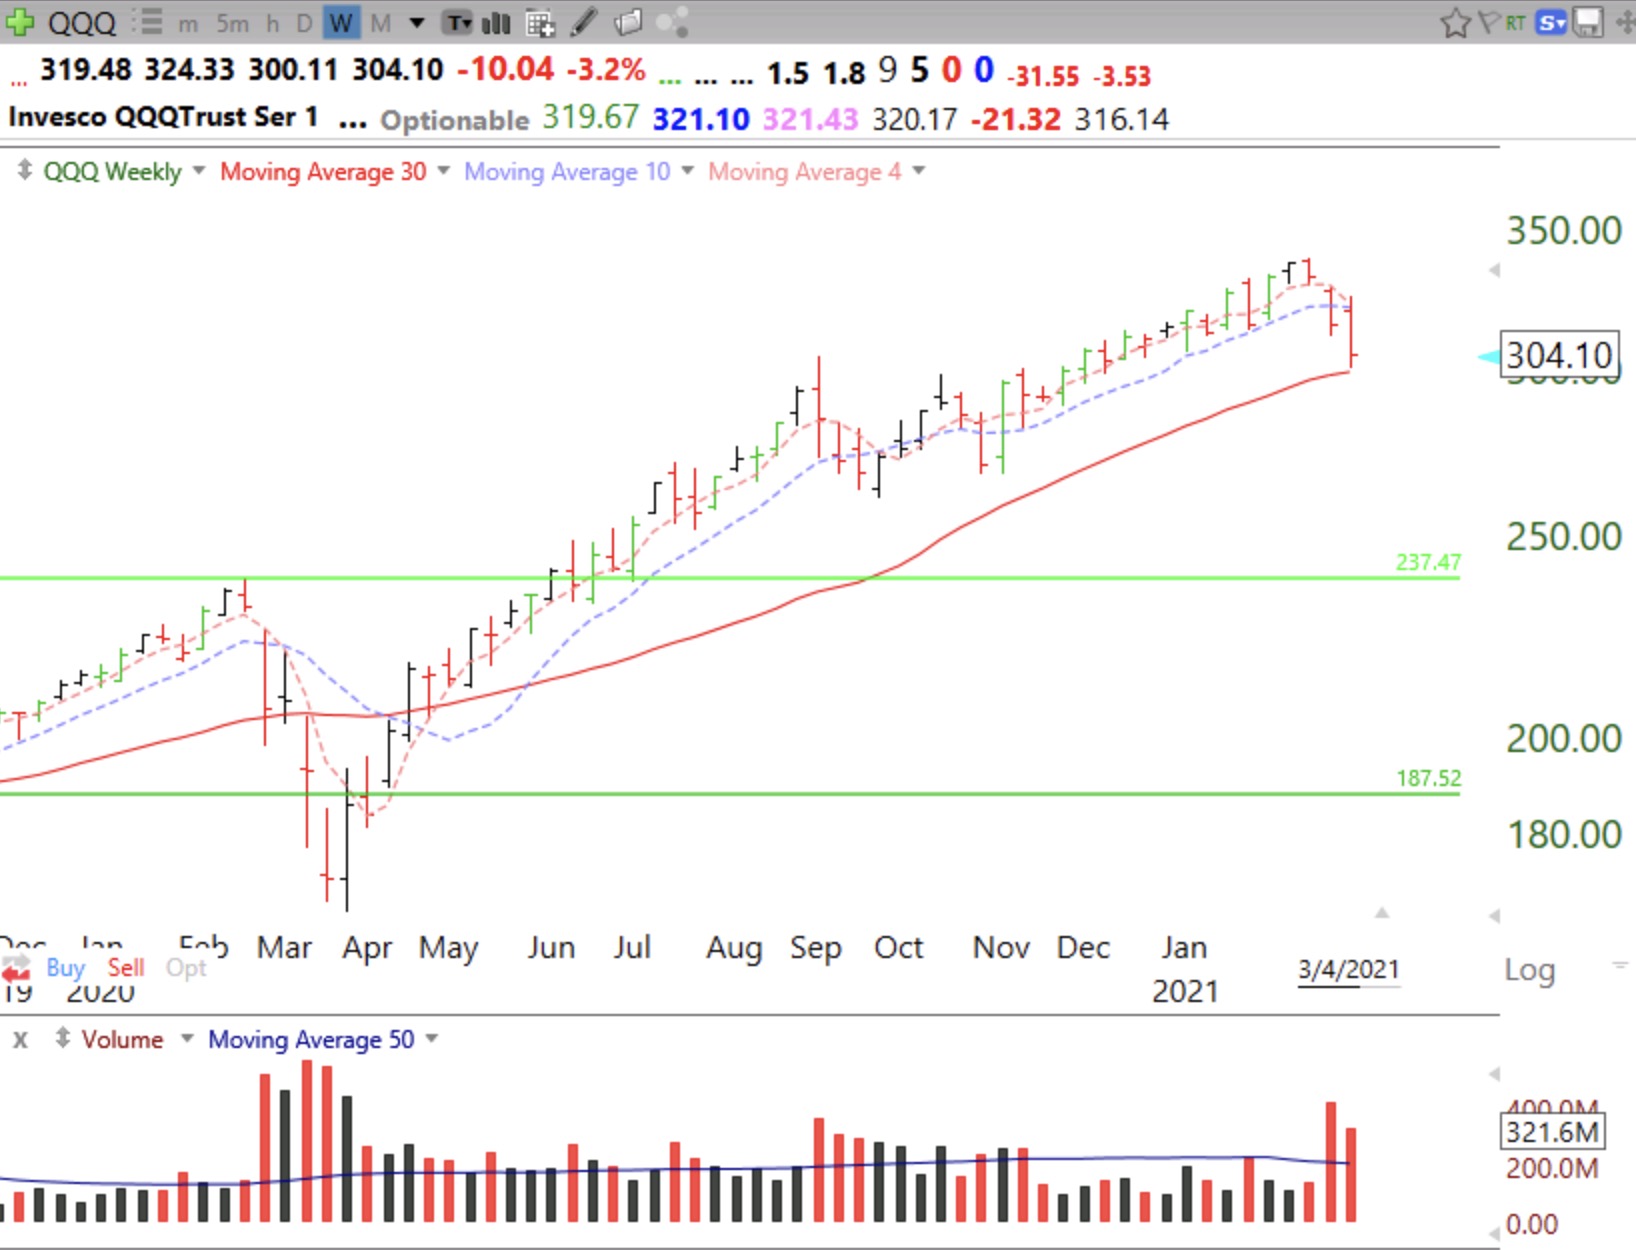
Weekly chart shows QQQ still above critical rising 30 week average (solid red line). It is therefore still in a longer term Weinstein Stage II up-trend. Notice the heavy selling the past 2 weeks. A close below this average would be a dire signal. In the past, I would exit the market in my university pensions when the 30 week average curved down. When that happened it was often the beginning of a major market decline. Stay tuned. The buy the dip crowd is getting a taste of how difficult it can be to ride the market. The GMI has closed below 3 for 2 days and this has triggered a Red signal. It is much easier to make money trading long when the GMI is Green. Mainly in cash in my IRA with a little SQQQ.
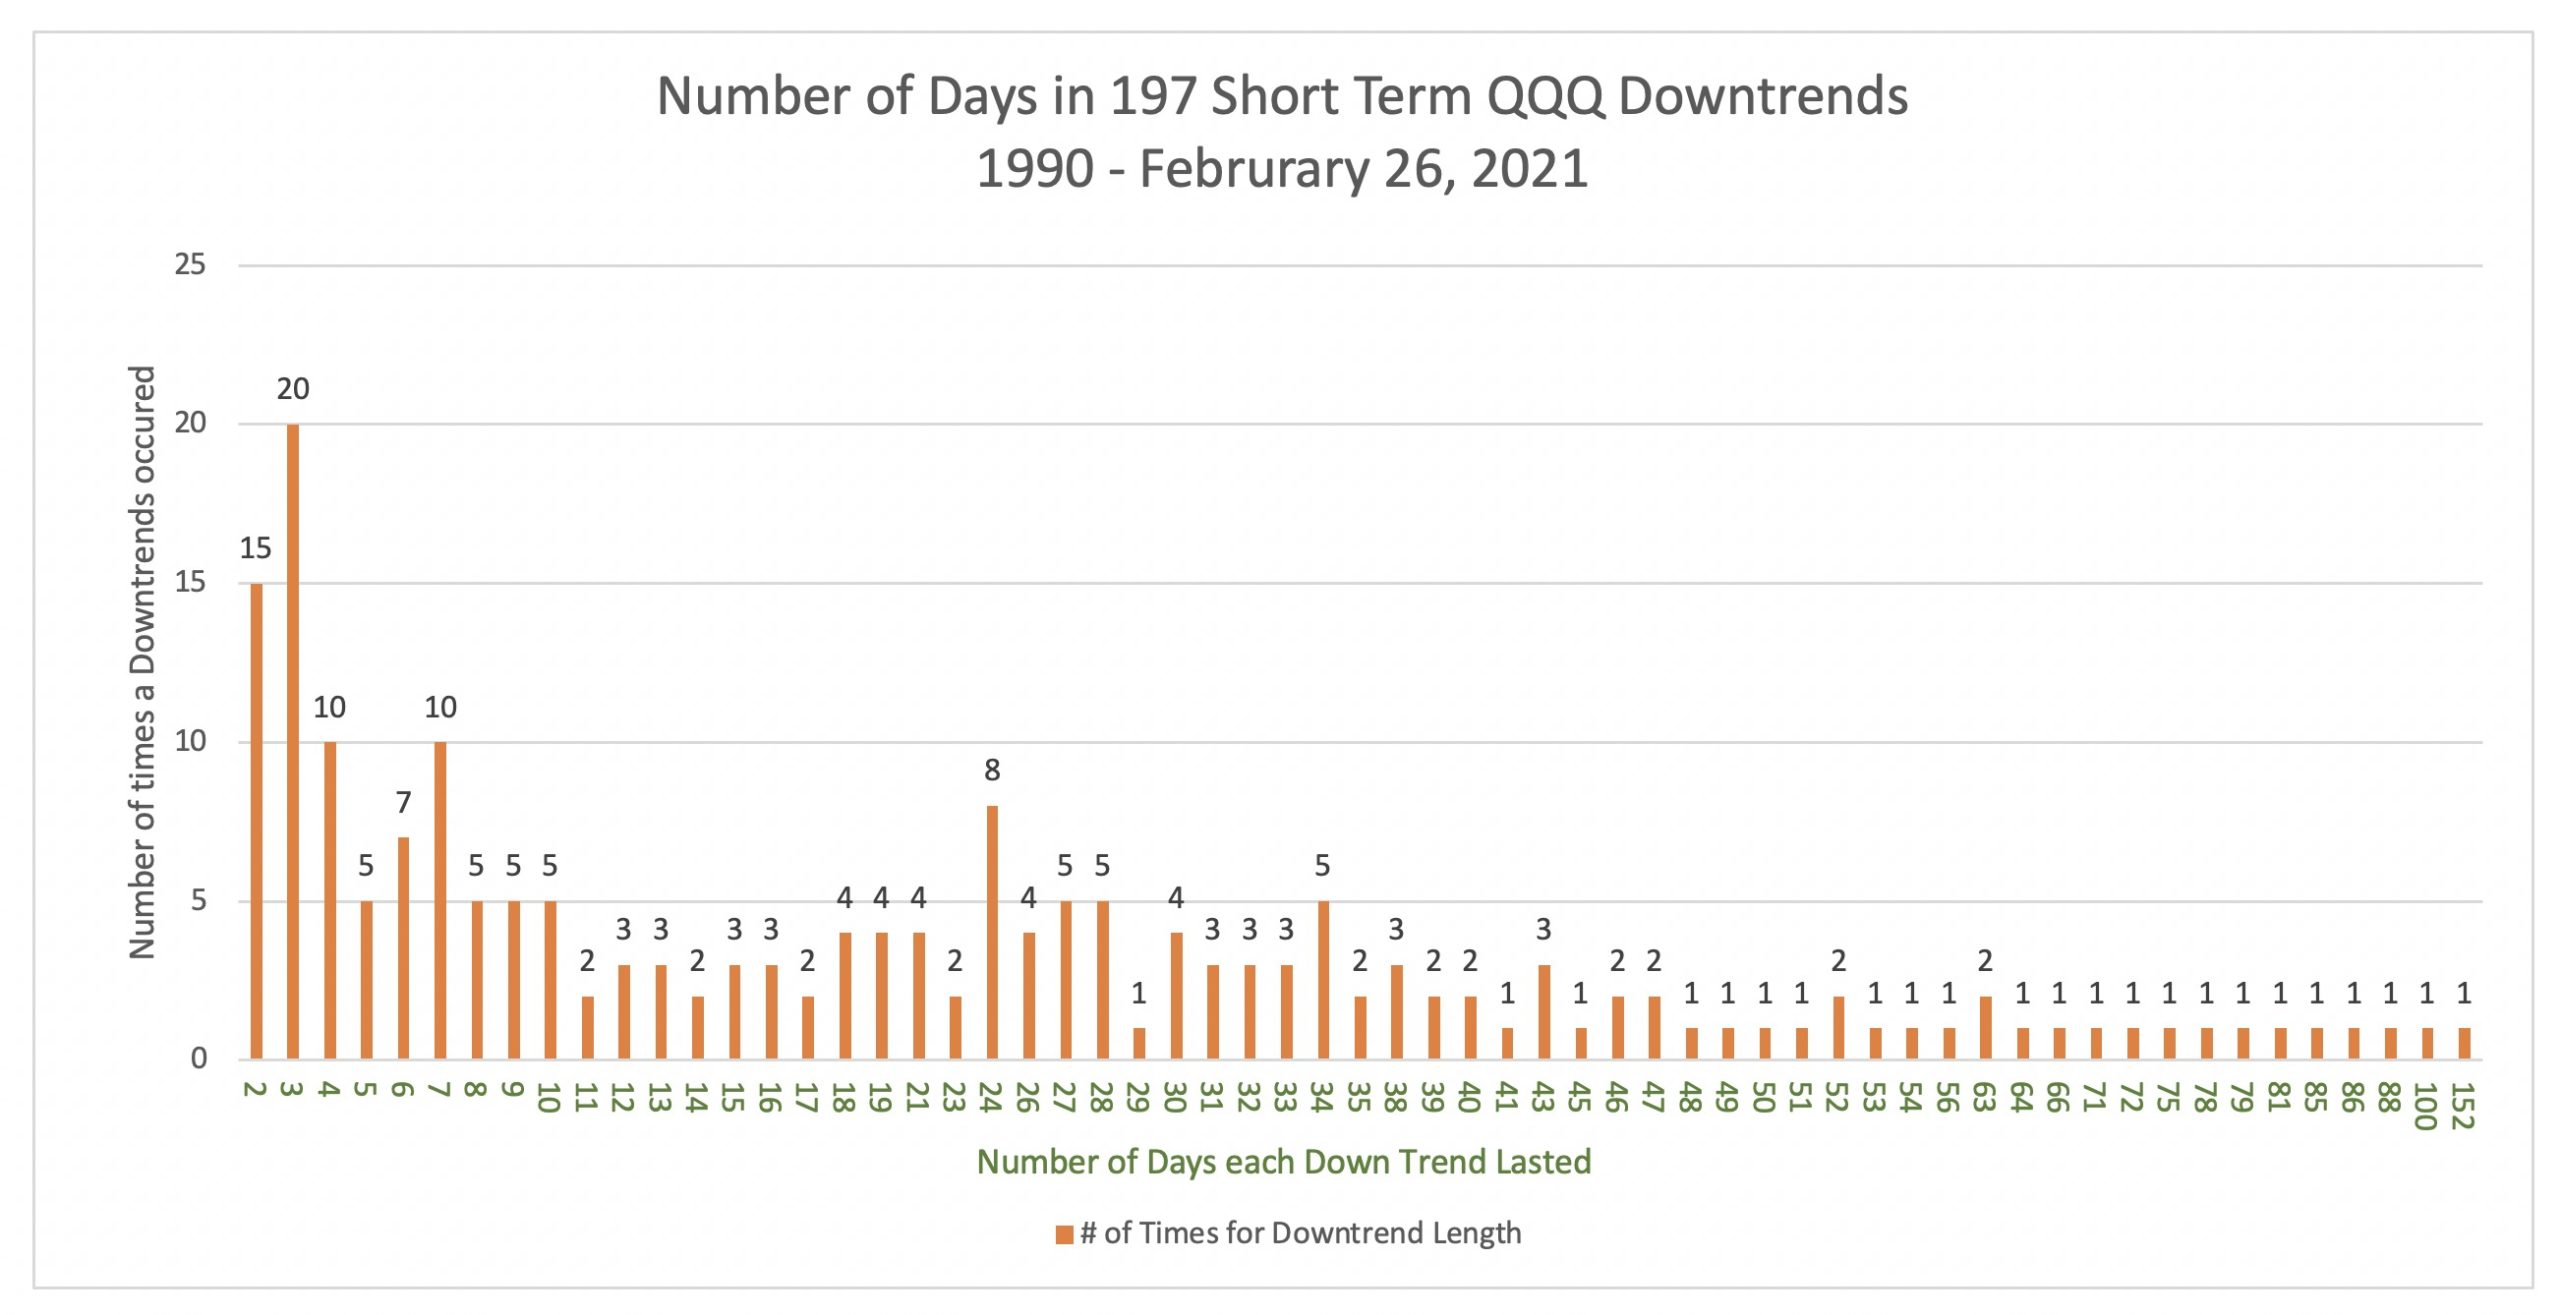
Our analysis of the 197 QQQ short term down-trends from 1990 through February, 2021 shows that 25% ended in less than 6 days. 64% lasted 6-49 days and 11% lasted 50 or more days. A QQQ short term down-trend is not the same as a bear market. A short term down-trend may end, followed by a brief up-trend and then a new down-trend. Once the down-trend passes 5 days, I know it can go on for many days and I buy some SQQQ. Below is a chart showing the length of down-trends that have occurred since 1990. The longest down-trend was 152 days. Wednesday was the 7th day of the new QQQ short term down-trend. I have objective rules for calling up and down trends.