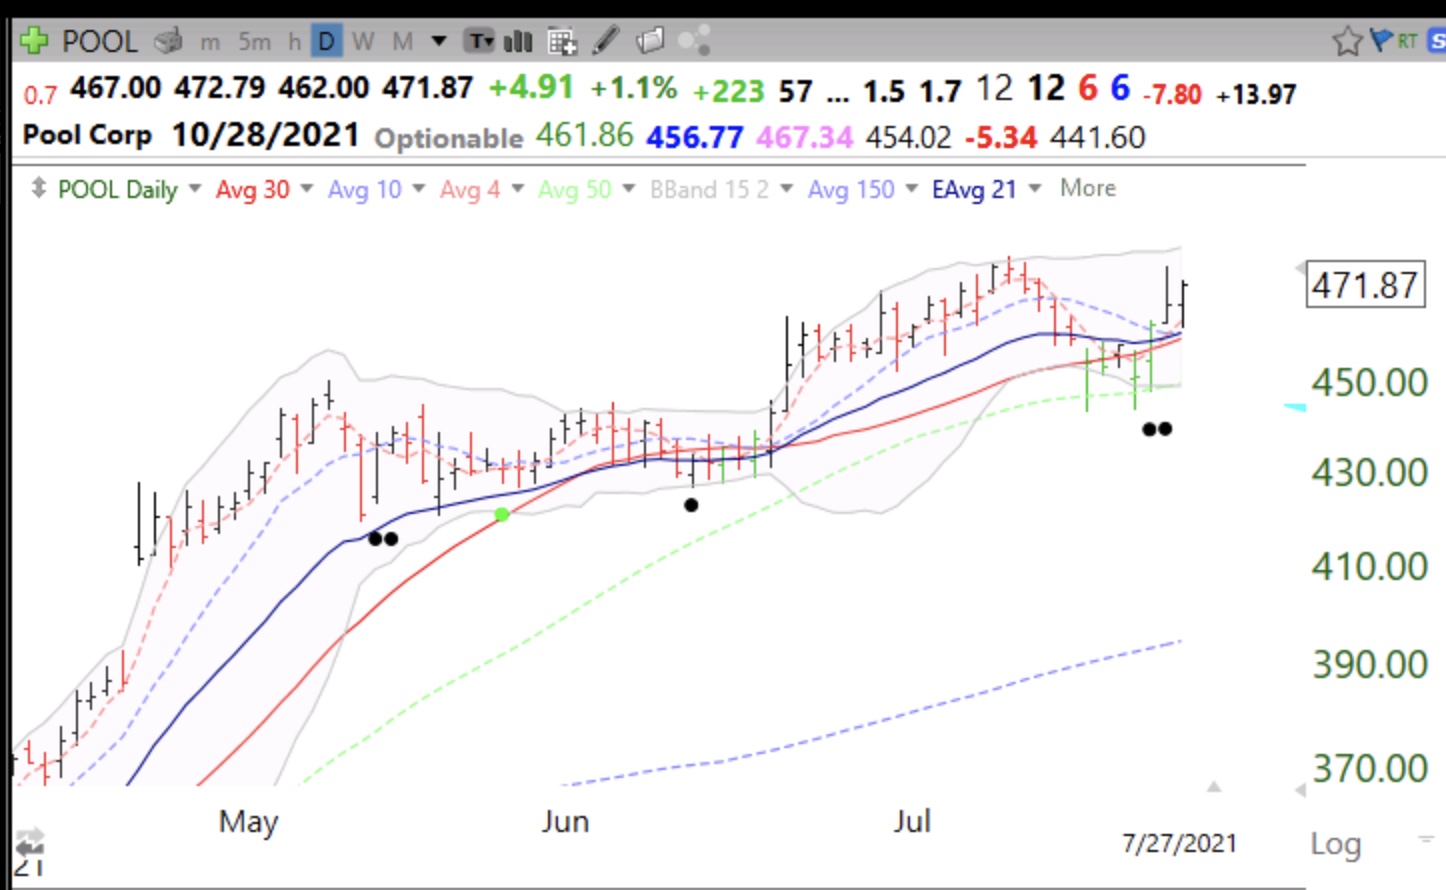
When the markets decline, it is easier to see potential leaders. Let’s see if the strength in POOL continues. Note the many black dot signals and its recent bounce off of the lower 2.15 daily Bollinger band, shown by green bars. I explained these signals during my recent webinar archived on the TraderLion site.