Ten times more new lows than new highs on Wednesday. Patiently waiting mainly in cash.
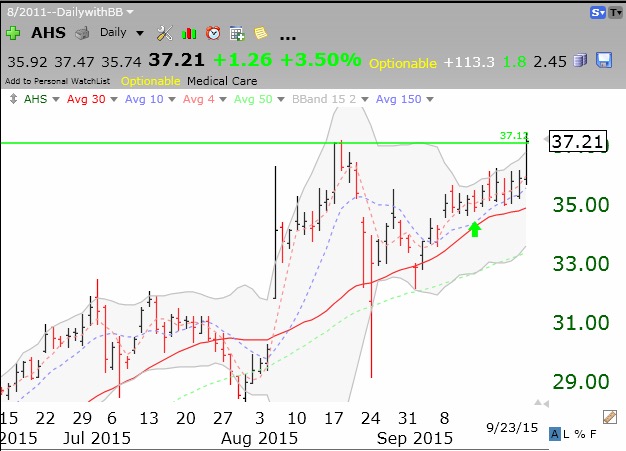
One exception is my small position in AHS, a stock my stock buddy, Judy, told me about some time ago. This daily chart shows It had a green line break-out on Wednesday. My students should have received an alert about AHS from my TC2000 program intraday on Wednesday.
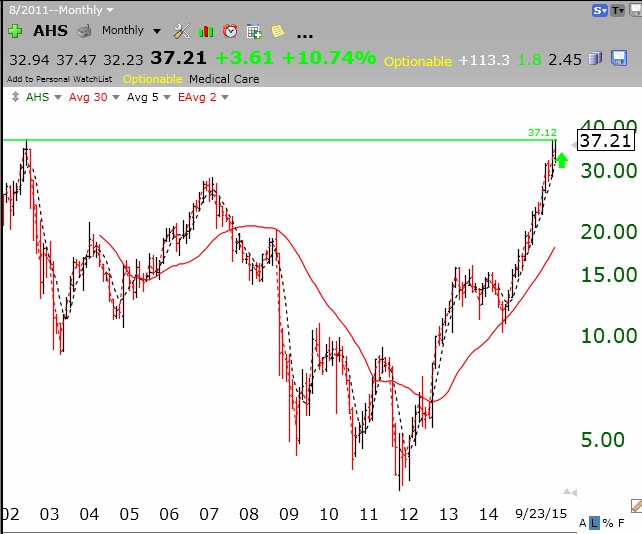
 Here is its monthly chart. AHS just broke its 2002 peak exhibiting a lot of strength in a weak market! Let’s see if it can hold the green line.
If you want to understand my trading strategy, check out the link to my free 2012 TC2000 user group presentation to the right of this page.