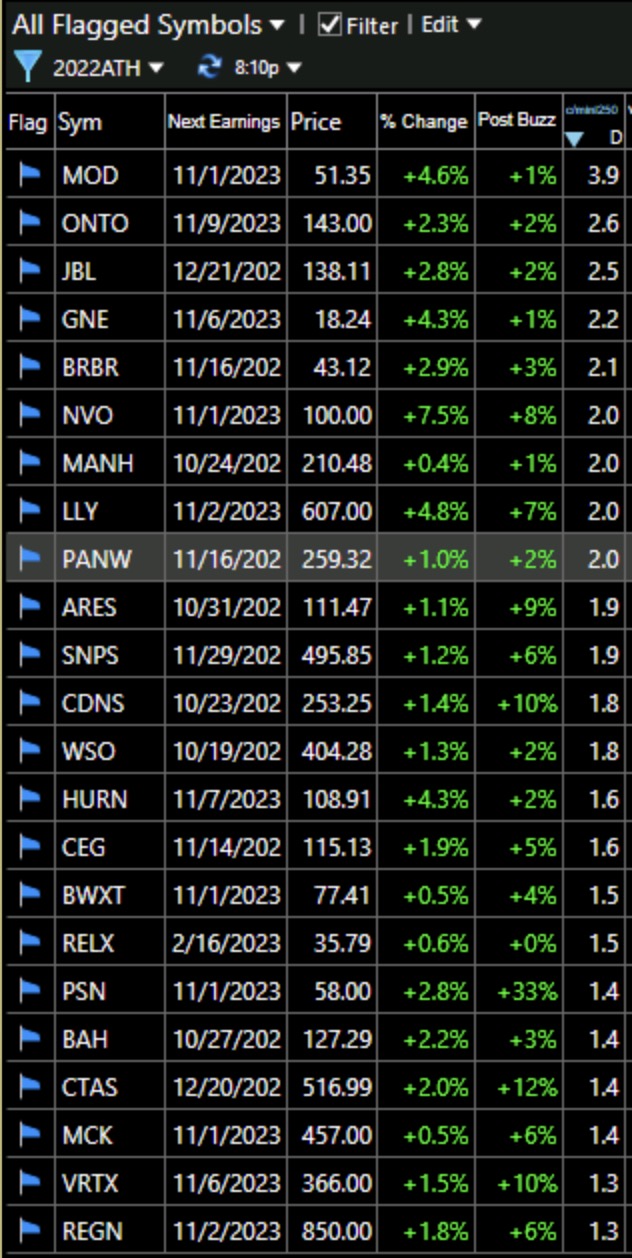
Blog Post: Day 57 of $QQQ short term up-trend; list of 4 growth stocks with Black Dot OSB set-up, see daily charts of $WWE and $KNSL

GMI6/6
GMI-27/9
T210874%

While many growth stocks were punished on Thursday, these 4 had promising bounces up off of oversold conditions. Each hit a recent yearly high or ATH (all-time-high). They are worth researching. Here is the list and the daily chart of WWE. Note that WWE is above its last green line top and has also found support at its lower 15.2 daily Bollinger Band. I bought a little in the after market and will exit if it trades below Thursday’s low (104.34).

Here is what a successful OSB set-up looks like.


Blog Post: $CAVA’s break-out fails–why I prefer my OSB set-up over break-outs, see daily charts of $CAVA and $MLM.

GMI6/6
GMI-27/9
T210876%

CAVA opened up above the prior day’s high and closed back below its break-out line. Breakouts sometimes fail and if someone bought at Thursday’s open they would have a large loss. I find it more difficult  to control my loss with a failed break-out. Where should one place their stop loss? It is not always easy to designate that in advance. However, with the OSB (oversold bounce) set-up it is much easier to determine the price where the set-up has failed. Place the stop just below the low of the bounce, the placed where the black dot appears. Look at CAVA’s chart and compare it to the chart of MLM with an OSB.

The black dot shows the days of the OSB set-up.