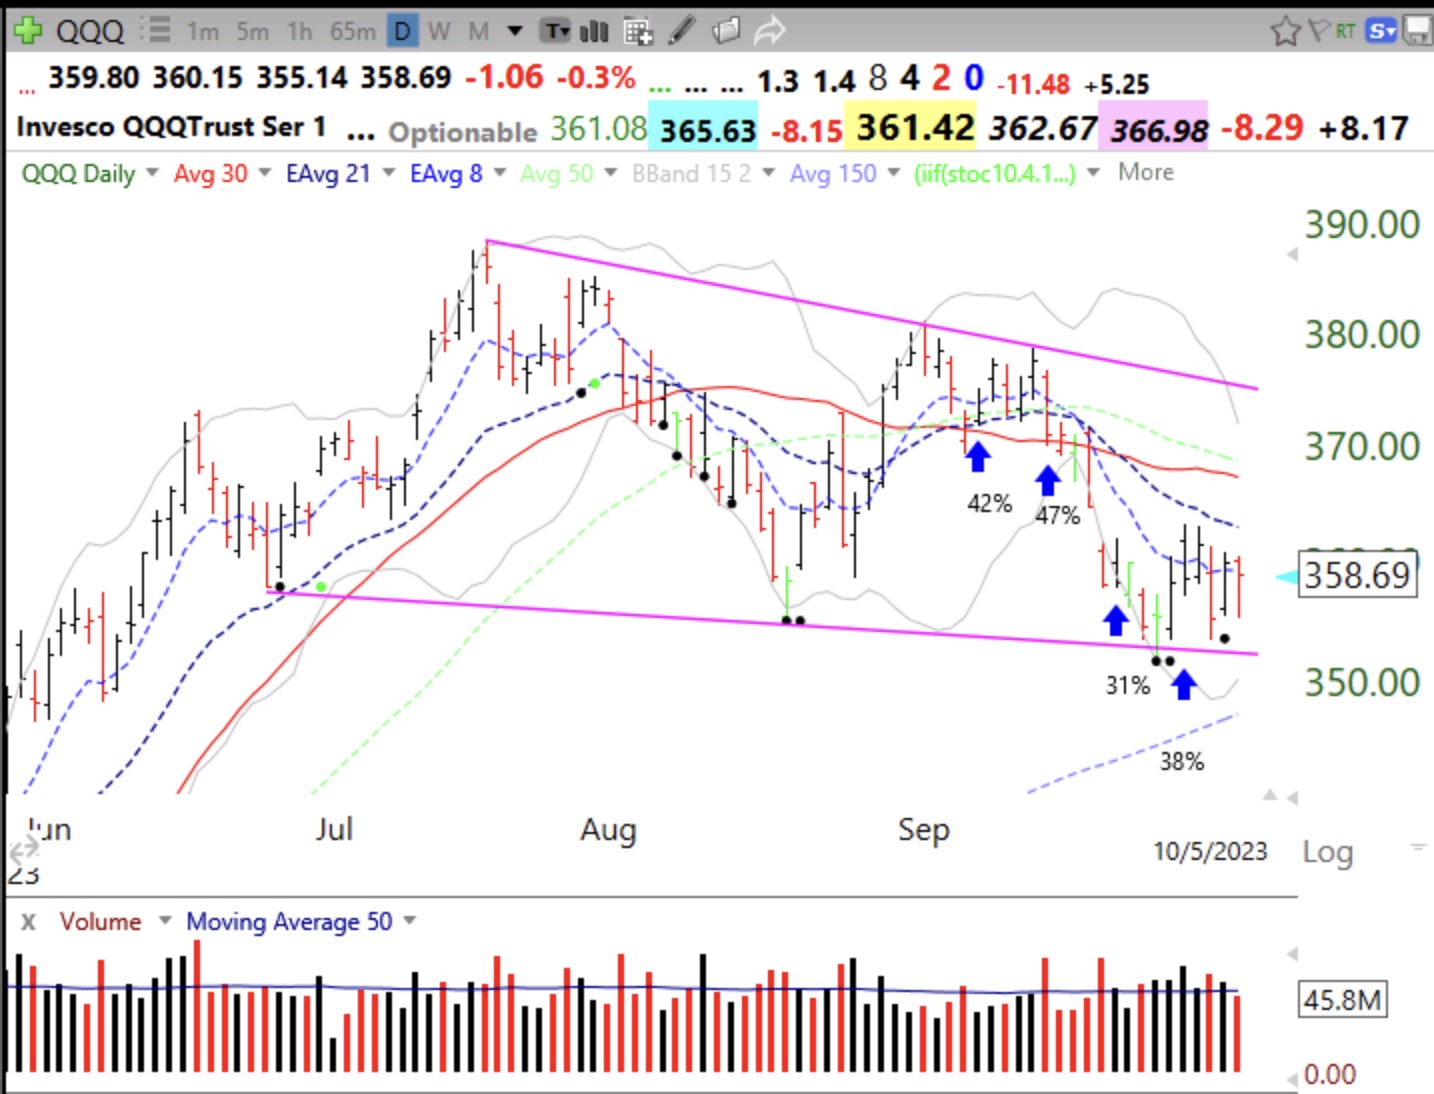
Vas, from @TCLTrader, comes to my class each year to teach his technical analysis based on the works of Al Brooks. Vas draws trend channel lines, TCLs, below a down-trend as I have drawn in the daily chart below. It is amazing how some TCLs predict in advance exactly where support or resistance occurs. You can learn Vas’ techniques by attending online the Northern Virginia IBD monthly MeetUps. The blue arrows designate the sentiment survey (% saying QQQ will rise near term) from my weekly undergraduate class.