The QQQ short term down-trend reached its 5th day on Friday and I took a small position in QID, the leveraged inverse ETF that rises as the QQQ (Nasdaq 100) Index declines. If the decline continues I will add more QID. I have learned that it is most anxiety producing to bet on a trend reversal because, by definition, it differs from the most recent market trend which I have become accustomed to. However, I will trust my instrument, the GMI, and stay short or in cash in my trading accounts until the next buy signal. My very conservative university pension remains invested in mutual funds, as the longer term trend of the market remains up.
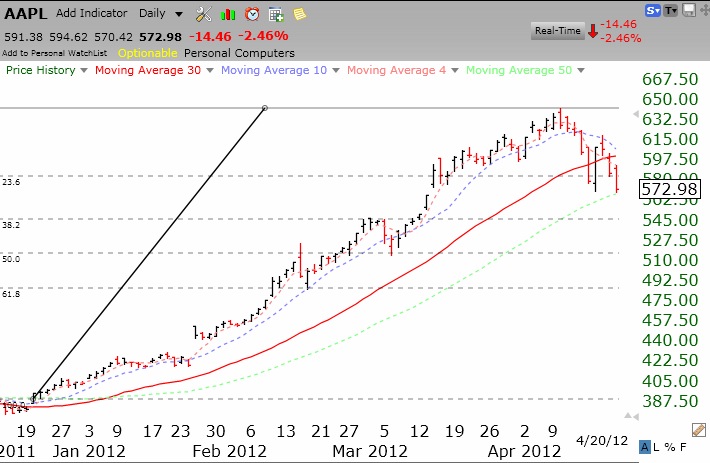
In addition, AAPL, the market leader, reports earnings on Tuesday and the stock’s reaction will tell me a lot about the market’s inclinations. If good earnings are met with a decline or flat response, then I will expect more weakness in the market. I have learned that I can make money trading AAPL by being long only when it is above its 10 week average. AAPL closed Friday at $572.98, just above its 10 week average of $570.79. A close below that level after Tuesday would tell me to be out of the stock, assuming I were still in it. (I typically sell a growth stock if it looks like it will close below its 30 day average and AAPL has closed 2 days below its critical 30 day average.) See my discussion of Fibonacci retracement targets for AAPL at the end of this post.
The GMI is at 3 (of 6) and the more sensitive GMI2 is at 2. 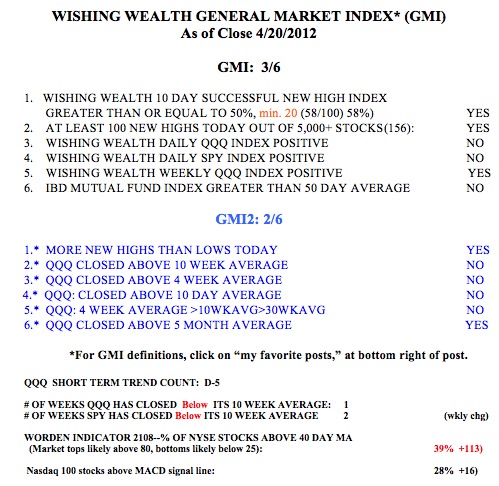 The GMI sell signal from 4/11 remains in effect. The QQQ has now closed below its important 10 week average. The SPY is weaker and has completed its second week below its 10 week average. The T2108 is at 39%, in neutral territory. Only 28% of the Nasdaq 100 stocks closed with their MACD above its signal line, indicating little short term strength. I remain short GLD by holding put options. I could also have bought the inverse leveraged GLD ETF, DZZ.
TC2000 has a tool for drawing Fibonacci levels. The daily chart below of AAPL shows the Fibonacci retracement levels of the advance that began in December. Stocks sometimes find support at these numbers (23.6%, 38.2%, 50% and 61.8%) which indicate the percentage of the preceding rise that the stock gives back. AAPL recently found support at the first level of 23.6%, but this level did not hold. The next projected levels of support, in order, are approximately 547, 518 and 488. Like with charts, these numbers sometimes work because people think they do and buy at these levels. So, if AAPL breaks below its 10 week average this week, the next support may come in around $547 per share. Click on chart to enlarge.