Blog Post: Day 3 of $QQQ short term up-trend; 166 new US highs, 33 lows and 59 at ATH; my 10:30 weekly charts of $QQQ and $SPY show continuing Stage 2 up-trends

GMI6/6
GMI-26/9
T210843%

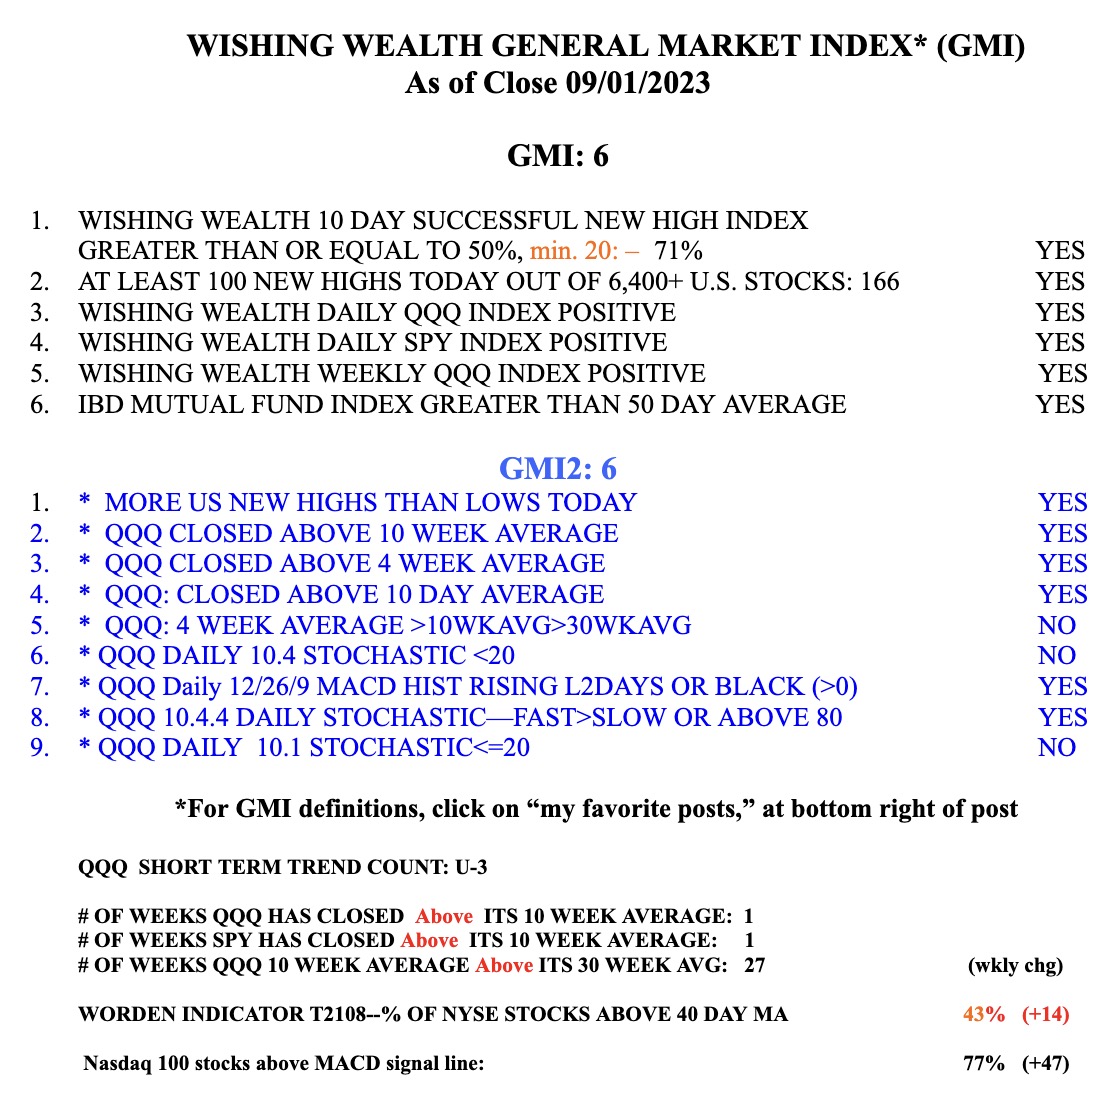
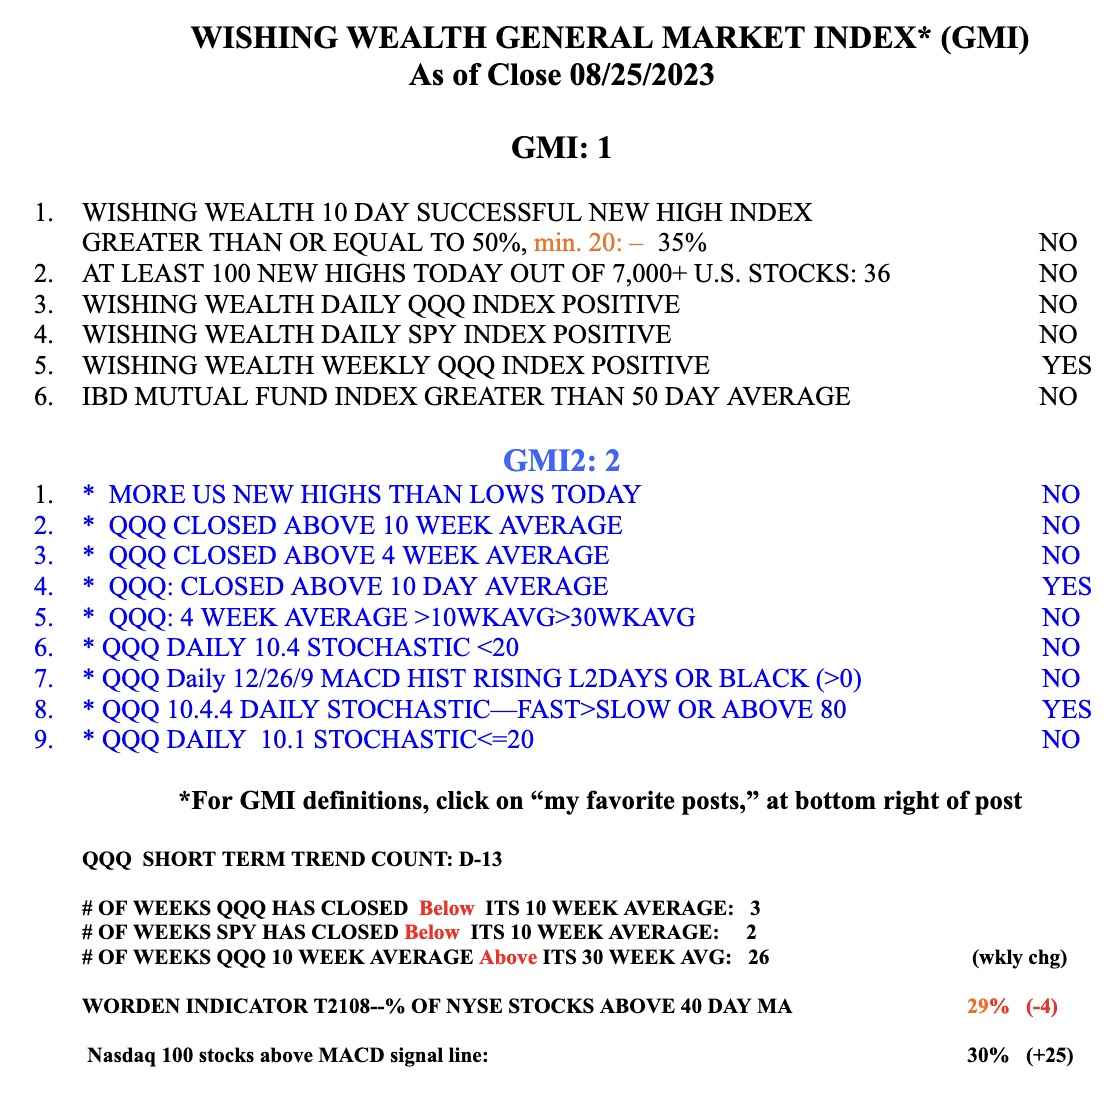
Many fear a weak September, especially with a government shut-down on the horizon. But the market may  defy all and rise anyway. The QQQ short term trend count is now up and the longer term GMI is Green, see the GMI table below. I bought a little TQQQ last week and will add more if the new QQQ short term up-trend holds. I am more confident of a new short term up-trend once it holds for 5 days. My analyses show that about one quarter of new QQQ short term up-trends end within 5 days, so I add more TQQQ very slowly. The last short term up-trend lasted for 70 days and TQQQ ran up +26%. TQQQ climbed much higher than that if one had sold before the up-trend actually ended.

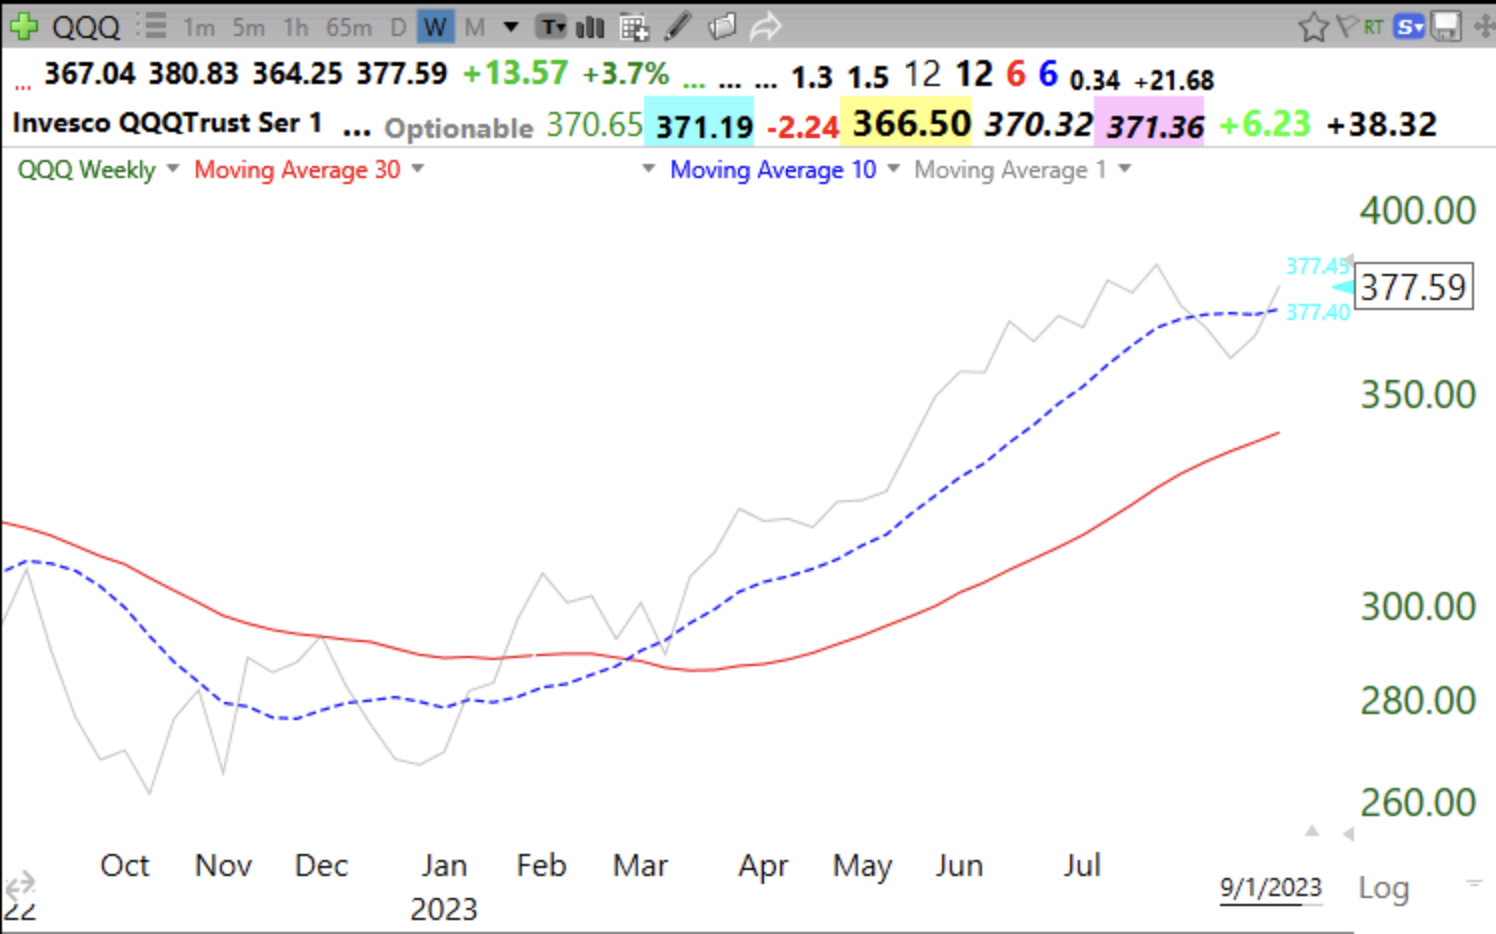
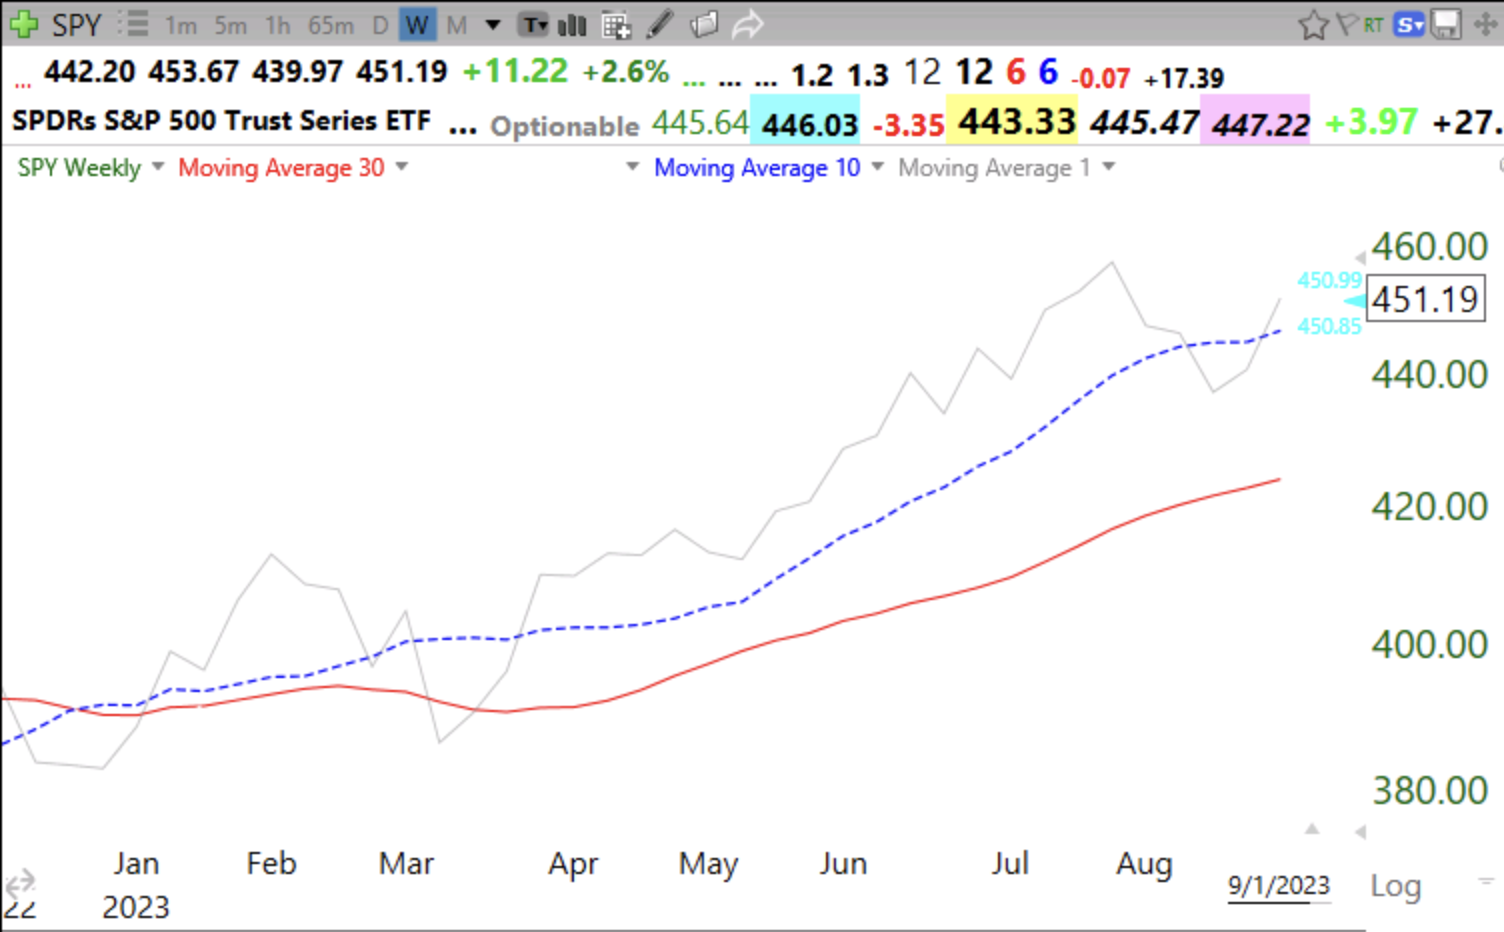
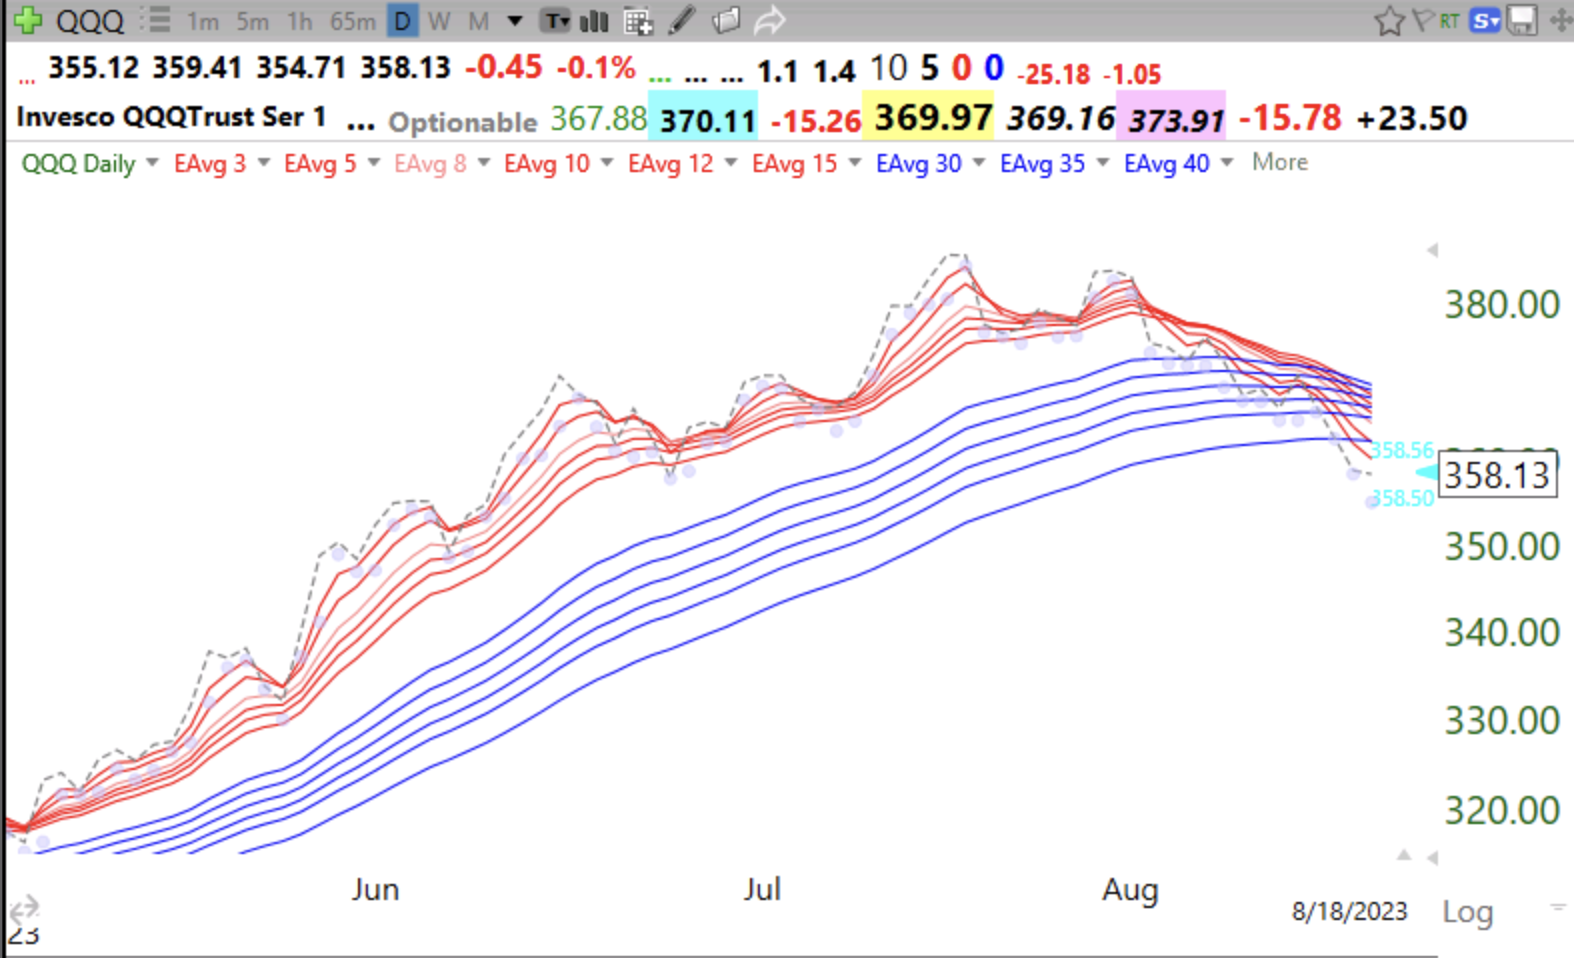
This 10:30 weekly chart shows QQQ in a continuing up-trend. Note that QQQ recently closed (gray line) back above its 10 week average (dotted line). The 10 week average has been rising above the 30 week average for 27 straight weeks, see GMI table below, and QQQ remains in a Weinstein Stage 2 up-trend. So is SPY.

Blog Post: Day 13 of $QQQ short term down-trend; 36 US new highs and 43 lows; time to be in cash or short $QQQ in my trading account by buying $SQQQ or a deep in the money put option, see example

GMI1/6
GMI-22/9
T210829%

QQQ’s 4wk average is now below its 10 week average, a sign of technical weakness. Failure to retake the 4 wk average (red dotted line) this week would suggest to me at least a decline to the 30 week average (red solid line at $337). The weak month of September is on tap and the GMI=1 and is Red. Time to be in cash, short (in SQQQ) or on the sidelines.

SQQQ is the the triple leveraged inverse of QQQ.

Another way to be short QQQ is to purchase a deep in the money put option on QQQ. If QQQ declines in September to the 30 week average, the put could rise a lot. For example the September, 29  380 QQQ put is trading at about 17.75 x100= $1775. Break even is 380-17.75= 362.25. Every point that QQQ is below 362.25 leads to a gain in the put of $100. If QQQ declines to 337 between now and the end of September, this put would trade at around $43 (380-337), yielding a gain of $25.25 (x 100) on an investment of $17.75 or +142%. The risk, of course, is that QQQ rises a lot and one could lose the entire cost of the put. When you buy an option you cannot lose more than you paid for it, so at least your loss is capped. Study how options work. I like Michael Sincere’s book, “Understanding Options.” I used to assign it to my honors course students.

Blog Post: Day 8 of $QQQ short term down-trend; $QQQ,$SPY,$DIA,$IWM closed below all 12 averages in my adapted daily Guppy charts, see chart of $QQQ; “Come back at Halloween” but I do own some $ACHR

GMI1/6
GMI-22/9
T210833%

My modified daily Guppy charts show that the RWB up-trends are over and with the major indexes closing below (dotted line) all 12 averages, it is possible we will see BWR down-trends (shorter term red lines declining below blue lines with a white space between them). The key in technical analysis is to be prepared to react once a trend is in. Friday was the 8th day of the current $QQQ short term down-trend. Being long right now is fighting the tide. It is so much easier to profit on the long side when the GMI is Green and the short term trends are up. Here is the daily modified Guppy chart of QQQ. All of the major indexes have similar patterns.  We are in the post earnings release period when the market tends to wander or decline. When the third quarter earnings are released in October, we might see a new up-trend. The post earnings decline sets up the next rise. But rather than predict, I prefer to wait and then react. I currently am in cash and SQQQ and own a little ACHR in my trading IRA.

ACHR is a leader in the new electric vertical takeoff and landing industry. Cathy Wood is buying it and the weekly chart just looks very promising to me. Note the volume the past 3 weeks as ACHR has resisted the market decline. I almost never buy cheap stocks but my stock buddy, Judy,  alerted me to this new industry a long time ago. I posted about it a while ago and I own a few shares as a bookmark. I want to see it hold its rising 4 wk average (red dotted line).

The GMI remains Red. Both QQQ and SPY have closed below their 10 week averages. But the longer term trend of QQQ remains up with the 10 week above the 30 week for the 25th consecutive week.