Blog Post: Day 8 of $QQQ short term down-trend; 38 new US highs and 65 lows; $QQQ remains in a longer term Stage 2 up-trend, but not $DIA and maybe not $SPY; With GMI=1 and Red, it is time to be very defensive and maybe in a little $SQQQ, see daily charts of QQQ and SQQQ, but will last week’s bounce hold?

GMI1/6
GMI-23/9
T210824%

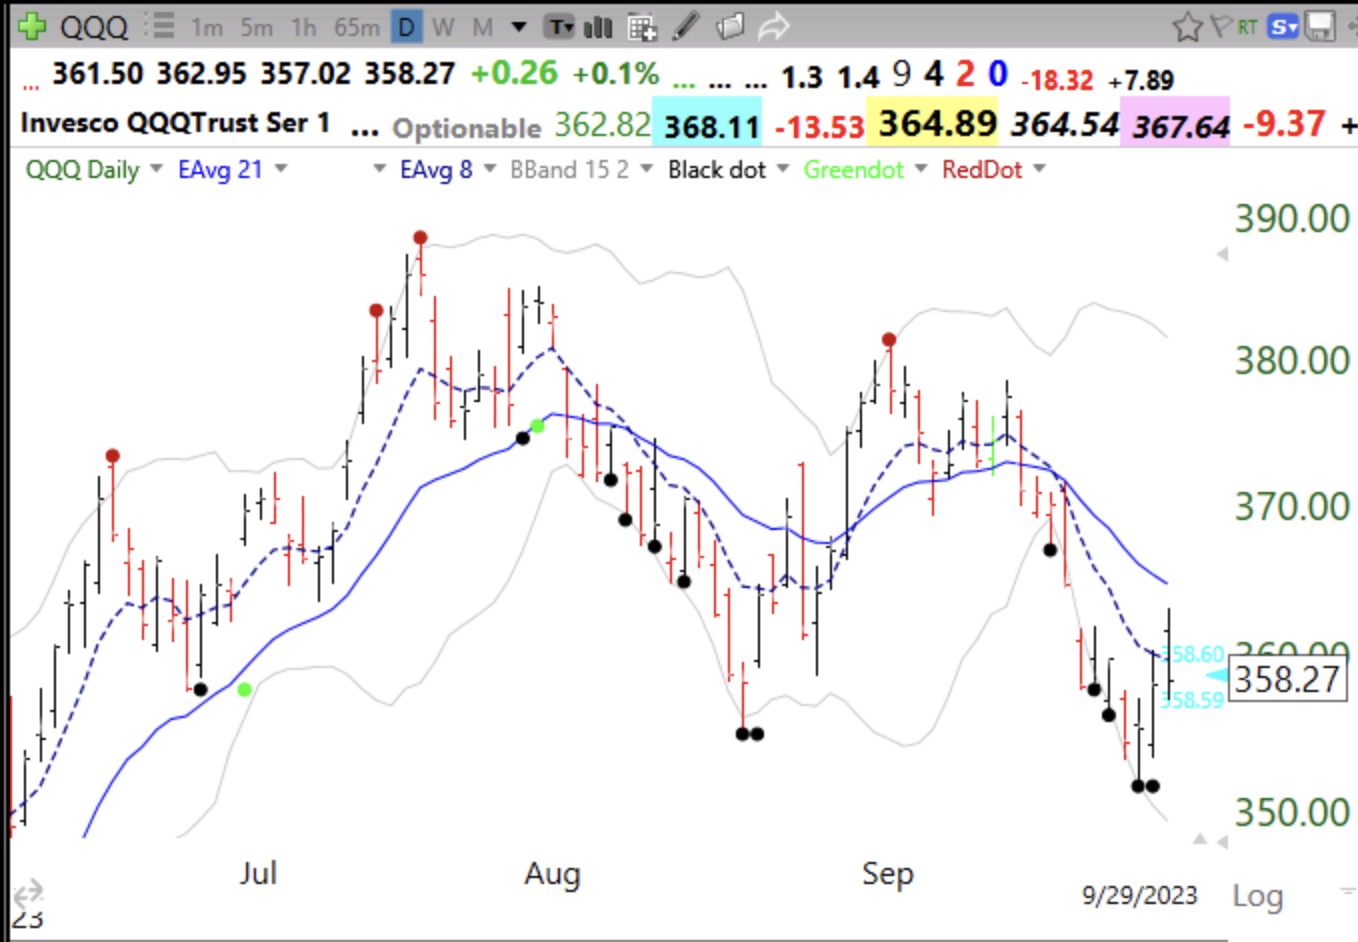
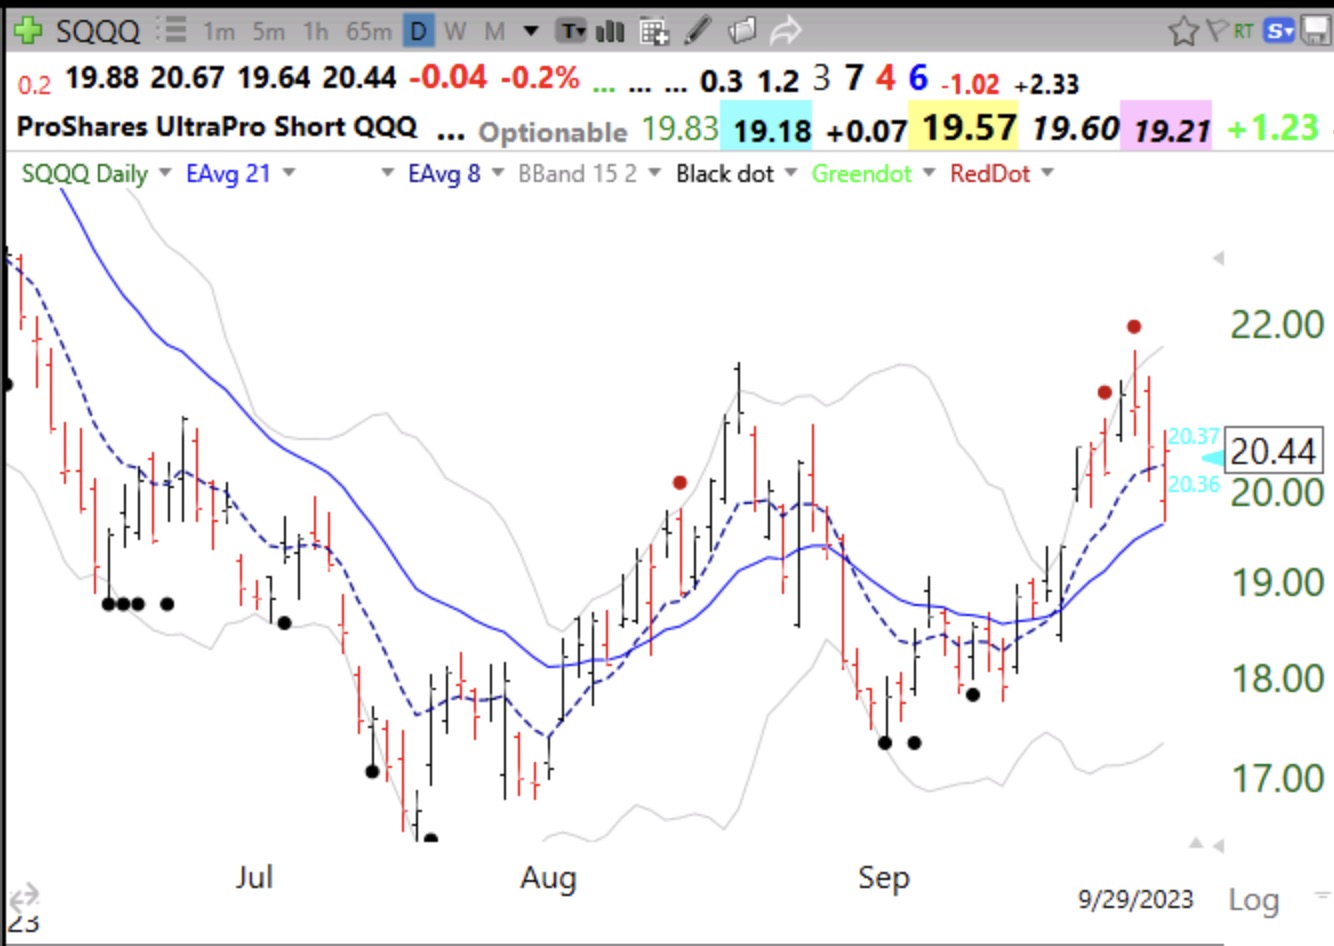
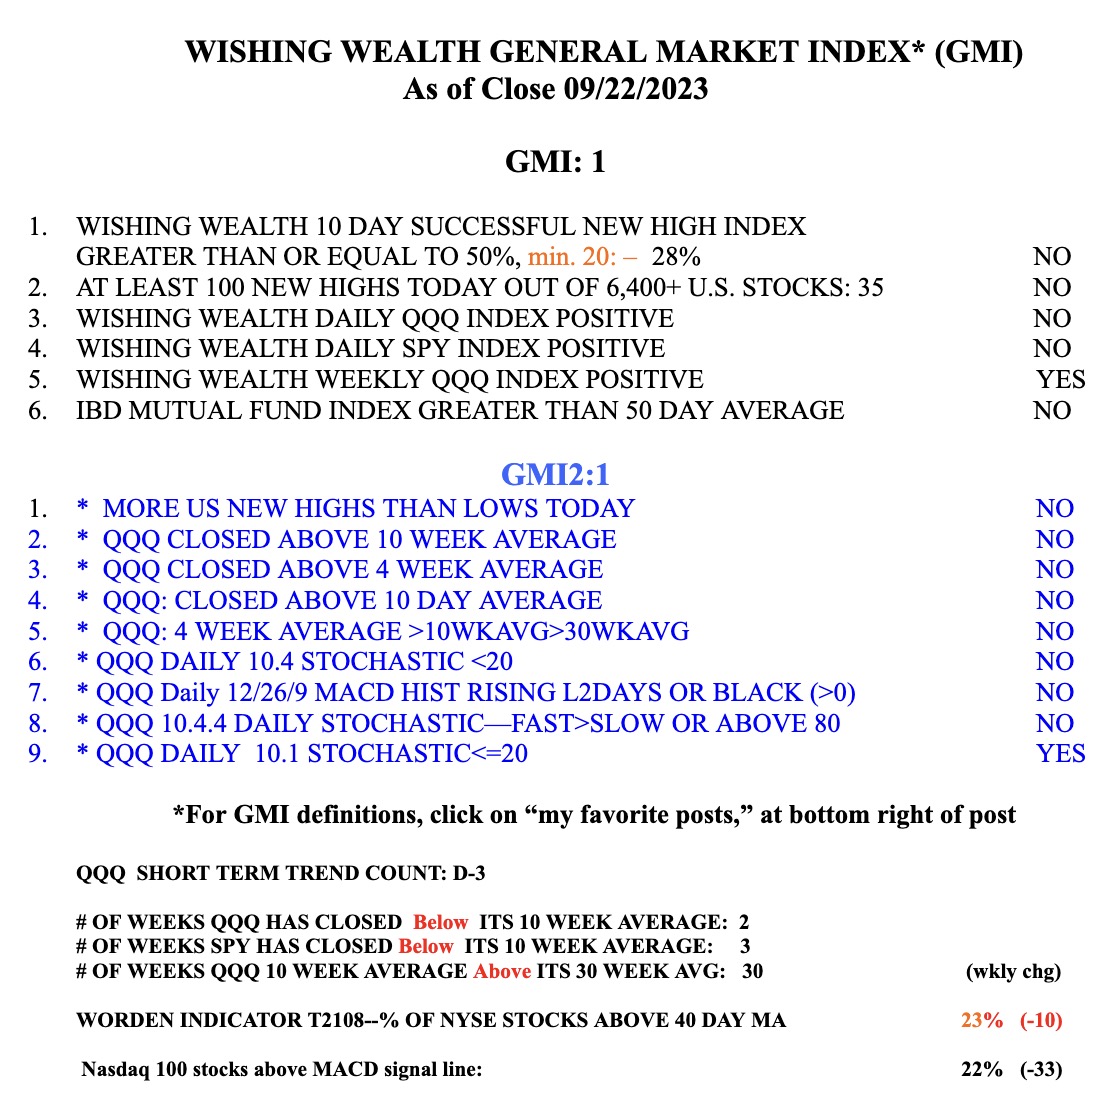
QQQ remains in a short term down-trend. One way to play this is to own a little SQQQ, a 3x leveraged bearish ETF, that rises when QQQ falls. But we need to be nimble because many down markets have ended in October. As the Sell in May saying says, return on Halloween. Let’s see first if last week’s bounce holds. It may present an opportunity to get into SQQQ a little lower.

Blog Post: Day 3 of $QQQ short term down-trend and GMI=1 (of 6) and Red; Put/call ratio rises to 1.09, indicating fear is rising, what would my trading gurus say?

GMI1/6
GMI-21/9
T210823%

Jesse Livermore might say, time to go fishing….. Darvas would call it a market for the birds. O’Neil would stay away, as I suspect would Minervini. And the perspicacious and man of few tweets,  David Ryan, said on August 24:


Blog Post: Day 7 of $QQQ short term up-trend; 69 US new highs and 81 lows; $SPY is back below its 10 week average and $QQQ is just above its; Big week for $ORCL coming up, see weekly chart

GMI3/6
GMI-23/9
T210830%

ORCL had a GLB (green line break-out) to an ATH (all-time high) in June on above average volume. It has then consolidated for 12 weeks. On Monday it will report earnings and a rise above 127.54 with above average volume  to an ATH would be worth monitoring. ORCL has already doubled its yearly low and MarketSmith indicates it has a comp rating=95 and RS=96. See weekly chart below. Two weeks ago ORCL bounced up off of its 10 week average (purple dotted line). Note that its 4wk avg>10 wk avg >30 wk avg, a sign of a powerful Stage 2 up-trend. When I miss a GLB, I may look to buy after a bounce up off of the 10 week or 4wk average. Study this chart for these set-ups. A green bar on this chart shows a bounce up off of a rising 4 week average that is also above its 10 week average which is above its 30 week average (30 week average is solid red line).