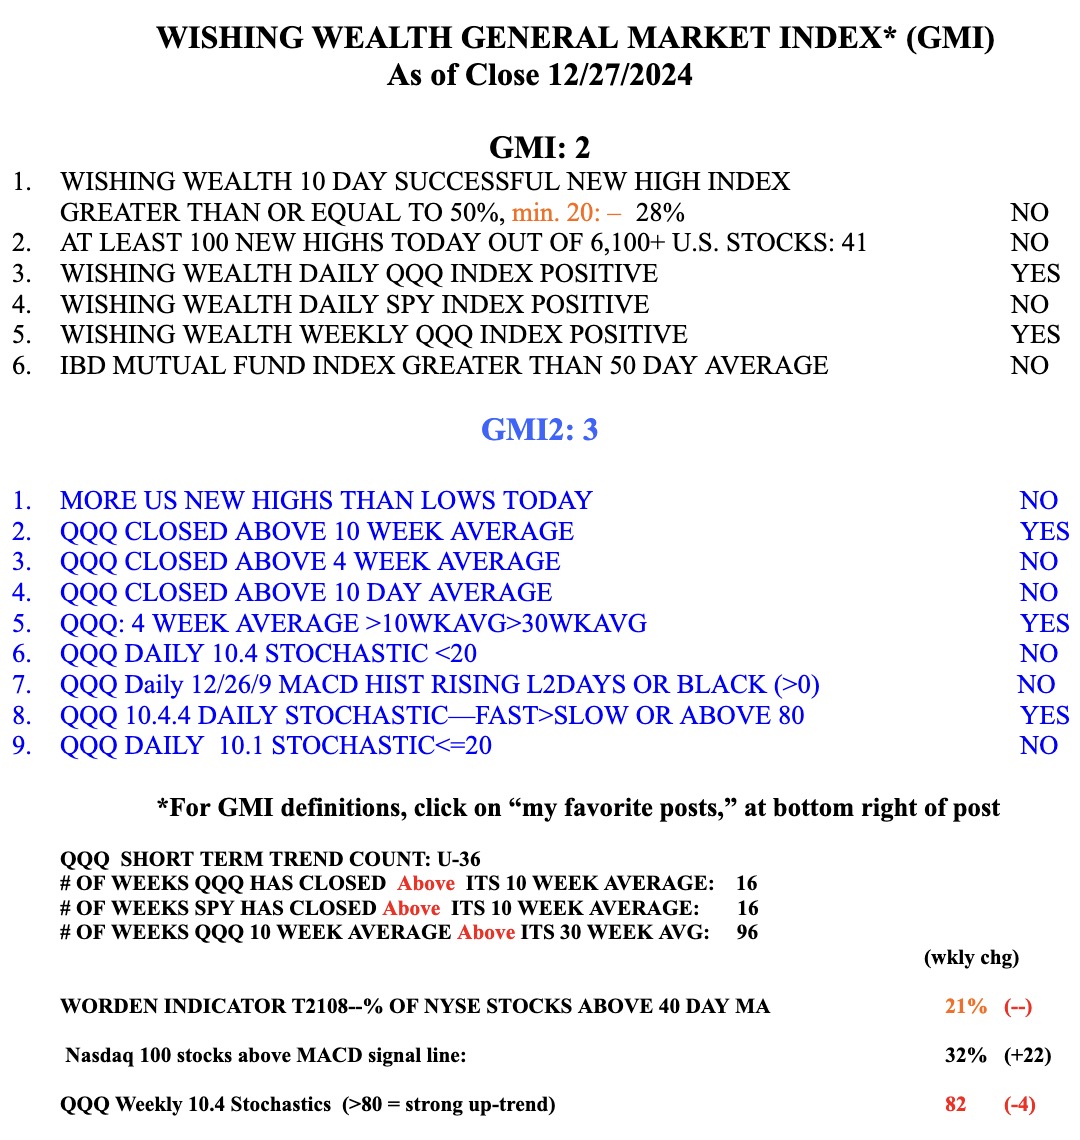
I will not post again until next Tuesday. I sold my SQQQ today after the strong showing of QQQ. I have noted that about 40% of the new QQQ short term down-trends end within 5 days. Let’s see what happens early next week. 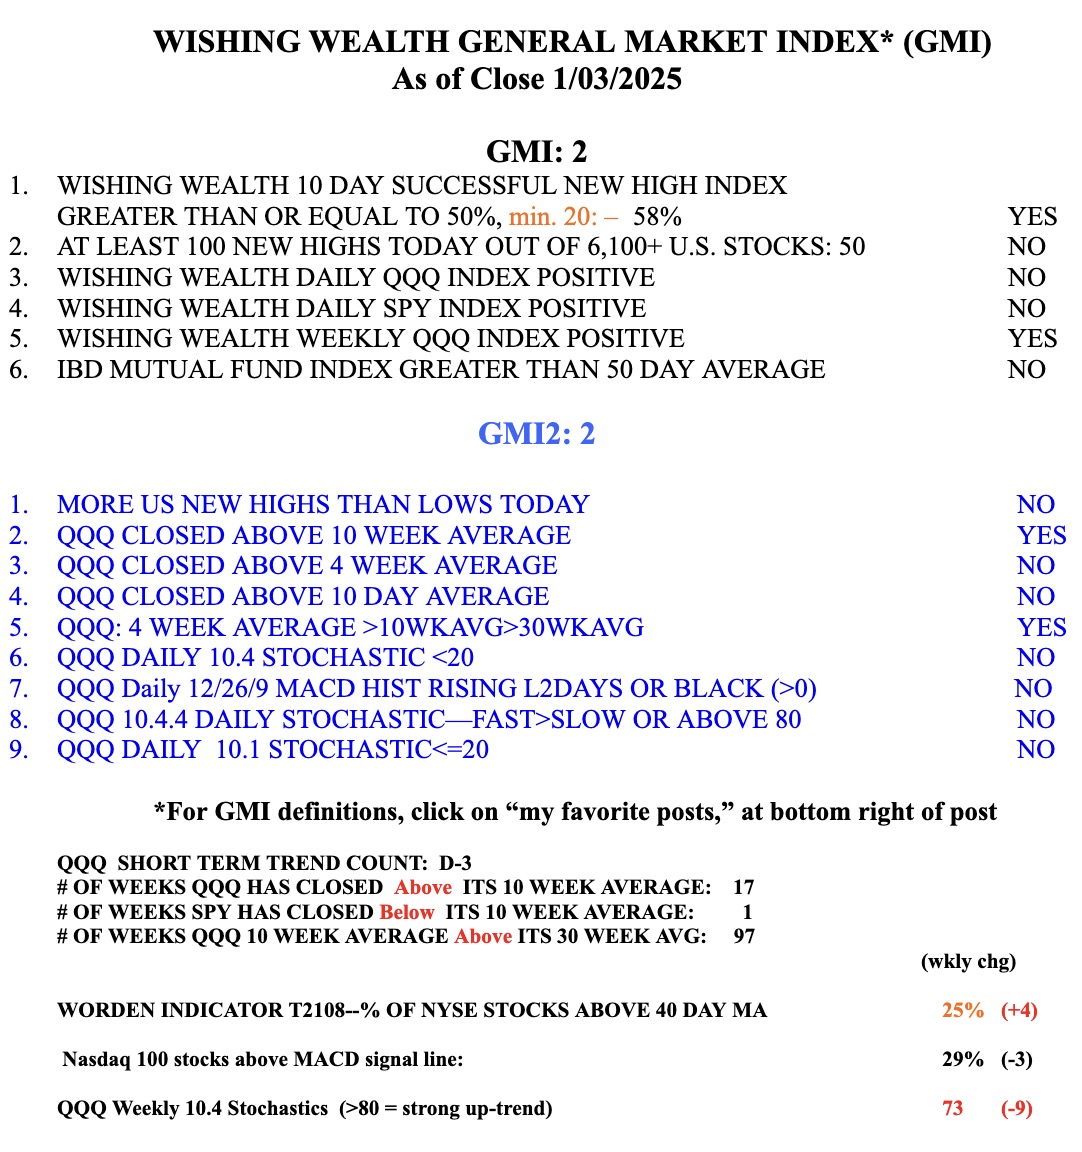
Screenshot
Stock Market Technical Indicators & Analysis
I will not post again until next Tuesday. I sold my SQQQ today after the strong showing of QQQ. I have noted that about 40% of the new QQQ short term down-trends end within 5 days. Let’s see what happens early next week.
Screenshot
While the market indexes remain above key moving averages, I am concerned about what is happening under the hood. Few stocks are hitting 52 week highs or all-time highs. There were more lows than highs on Friday. And the GMI=2 and is flashing RED. I remain mainly in cash in my trading accounts. I will not retreat in my longer term university mutual fund accounts until I see longer term averages give way and turn down. I am also concerned because so many stocks I have been following have had non-stop advances. Many persons may have been waiting until 2025 to take their gains so that they will not incur 2024 taxes. We must be very careful right now.
Screenshot
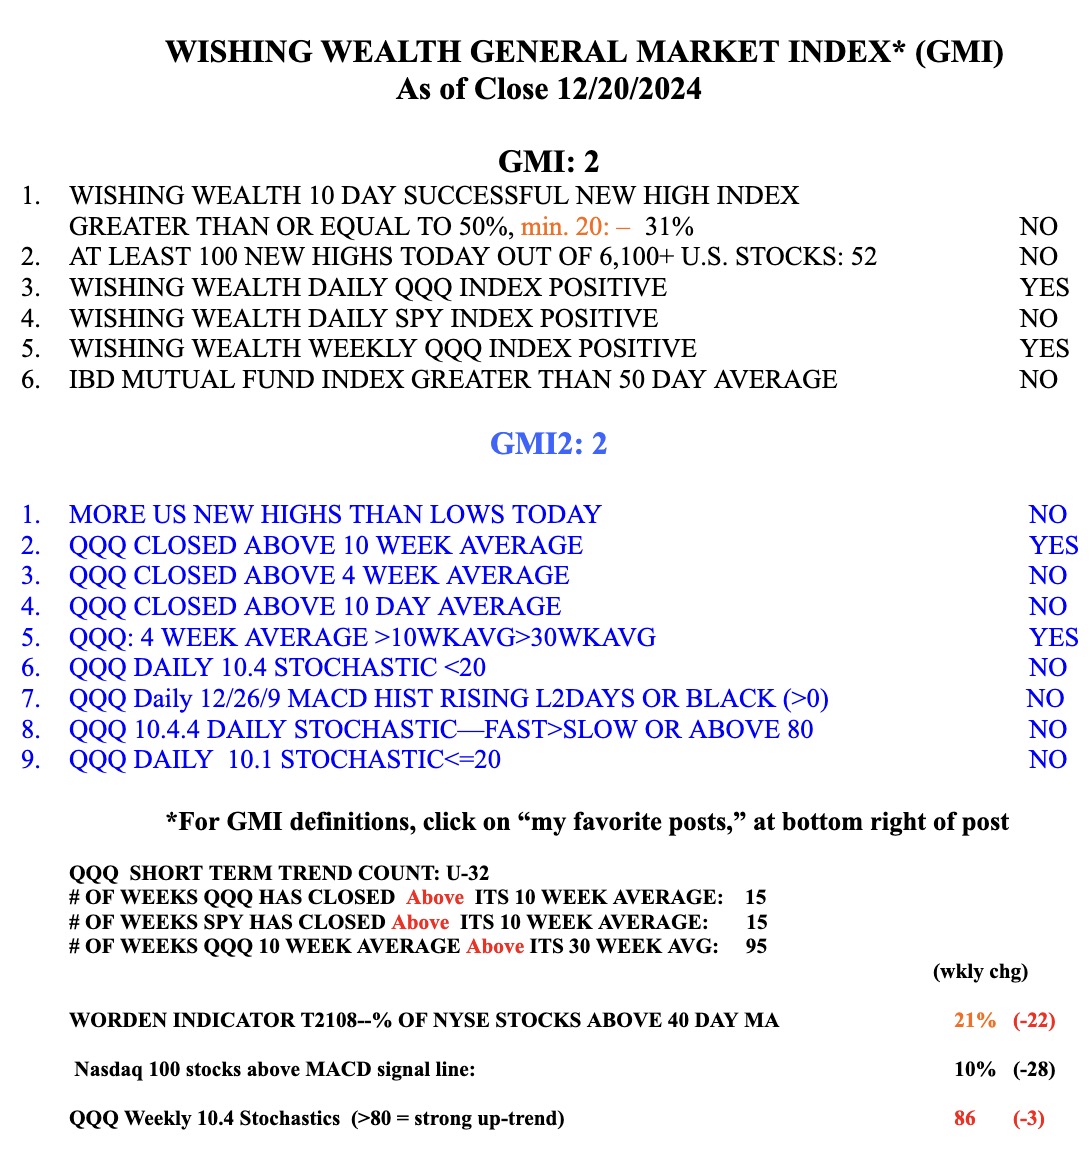
Friday was Day 32 of the current QQQ short term up-trend; It held. However, 79% of the Nasdaq 100 stocks advanced, compared with 58% of all US stocks. Growth stocks are again leading the market up. But my GMI=2 and is RED for the second day. QQQ, DIA, IWM and SPY reached very oversold levels on Friday. These levels are where these indexes typically bounce. If these lows do not hold, I suspect a larger decline is imminent. The good news is that QQQ remains in a solid longer term up-trend, as shown by my 10:30 weekly chart. QQQ is above its rising 10 (dotted) and 30 week (red) averages. Several closes (gray solid line) below the 30 week average would threaten this Stage 2 up-trend. Until then, QQQ is still in a sustained up-trend.

The modified GMMA daily chart shows that QQQ remains in a RWB up-trend. Note Friday’s bounce up off of the longer term, blue averages. Dotted line shows daily closes. Is the Santa Claus rally upon us?

Here are the components of my GMI. T2108 is at 21%, far above the levels where a major decline ends. But is this a major decline? Happy Holidays to all!