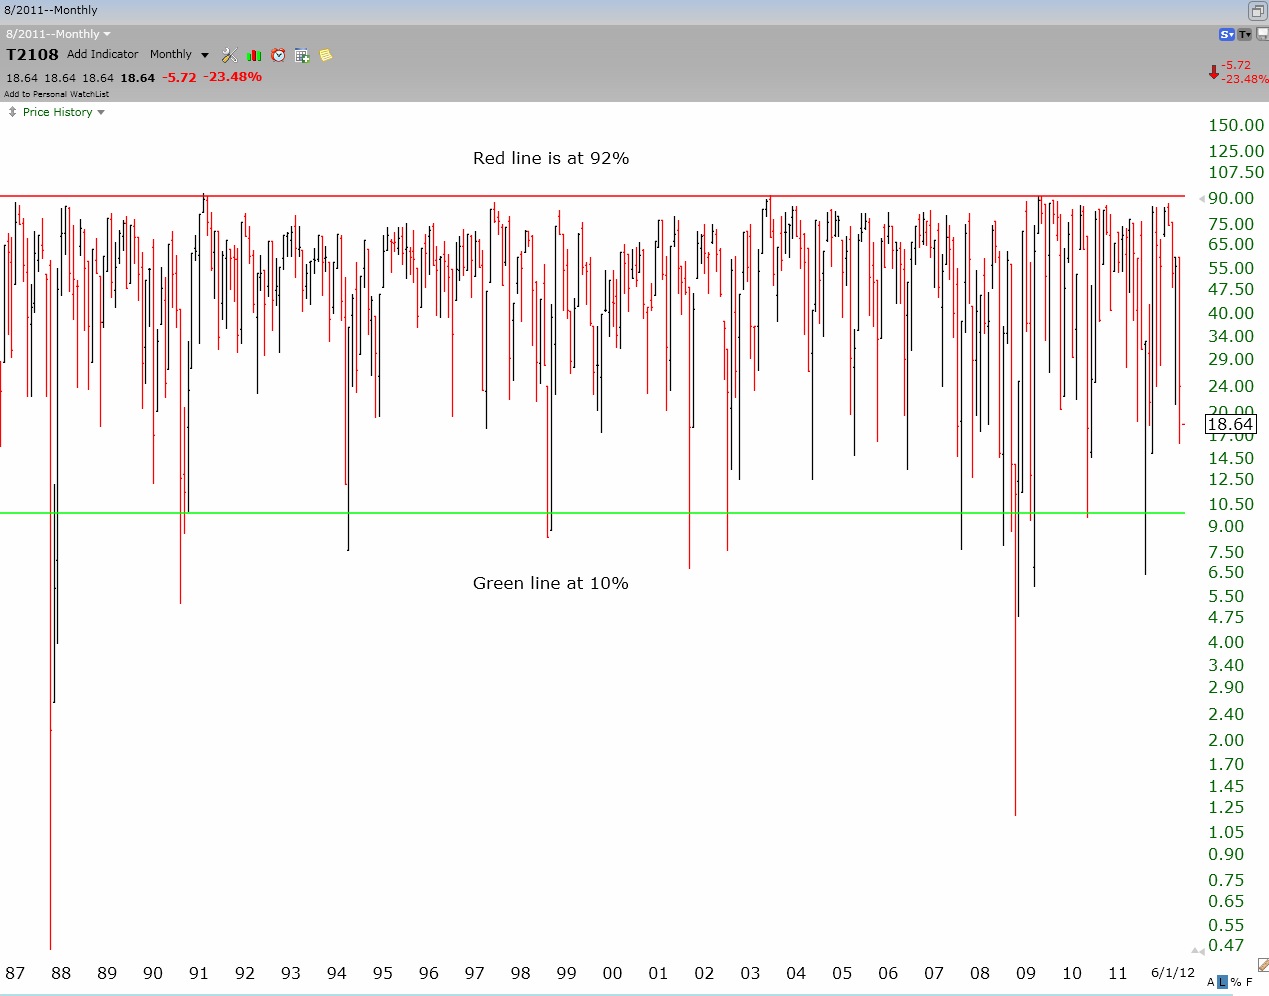
I am posting a monthly chart below of the Worden T2108 Indicator, which is available from its inception, in September, 1986. This indicator is available in the Worden products (TC2000 and freestockcharts.com) and serves as a pendulum of the market, ranging from extremely overbought to oversold. T2108 measures the percentage of NYSE stocks that closed above their simple 40 day moving average of price. While it cannot call a top or bottom, the more extreme it becomes, the greater the likelihood that the market is near a top (>80%) or bottom (<10%). (I did not get to post the intended T2108 video on Sunday, as indicated.) Current T2108 reading of almost 19% is not yet at a very extreme level. If T2108 gets into single digits, I will look to slowly buy an index ETF. Stay tuned…..
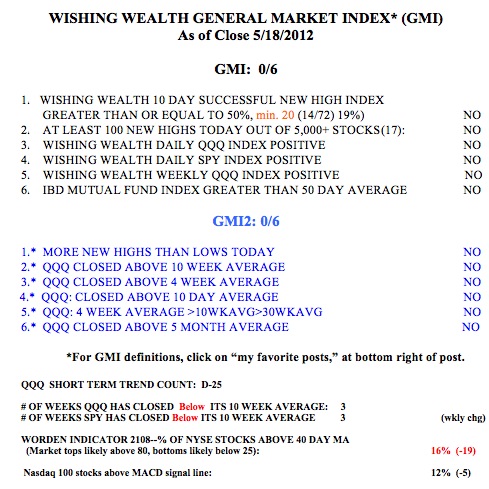
Meanwhile, all of my GMI and GMI2 components are negative.  Friday was the 34th day since I called a QQQ short term down-trend. Both the QQQ and SPY closed Friday below their critical 10 week averages. Only 37% of the Nasdaq 100 stocks closed with their MACD above it signal line, a sign of short term weakness. While we may get some follow-through weakness on Monday, it is noteworthy that 3 of the 4 indicators that I track to detect an extremely oversold market are now oversold. The put/call ratio is at 1.18, and is in the vicinity of the high level of bearishness among options traders which typically precedes a market bounce, at least for a day or so.
This market is currently in a short and longer term down-trend. No one can know for sure in advance when it will end. I am 100% in cash in my margin account, mainly in cash in my trading IRA, but invested 100% in mutual funds in my university pension where I am not permitted to trade often. I may take some money out of the mutual funds, however, when we get a bounce and I always continue investing new allocations in the funds each pay period. Dollar cost averaging into mutual funds during a decline is a good idea for me, because the general market will eventually come back. I never buy individual stocks on the way down because some (e.g., ENRN, GM) might never come back.