When I presented at the DC Worden Seminar two weeks ago, I asked the audience how many would buy a stock at a new high. Only about 5% of the 200 people in attendance raised their hands. I was incredulous. All of them admitted they wanted to buy a stock that went to the moon, but failed to understand that a stock that climbs to the sky has to hit new daily highs many times along the journey. People want to buy bargains, when stocks typically sell at a bargain price for a reason. If one wants to buy a terrific winner, one should not look for bargains. The greatest stock traders bought stocks at highs and sold them at higher levels.
Everyone would like to have profited from AAPL’s meteoric rise. How might someone have identified AAPL’s potential for growth before it took off? I went back and looked at AAPL’s performance from late 2011 on, just before the start of the December market rally. On October 17, AAPL hit an all-time high of $426.70. That high was broken on January 9, at $427.75. On January 18, AAPL hit a new high of $429.47 and by the end of January it had hit a new high on 4 days. The final new high that month was on January 31, at $458.24. This collection of 4 all-time highs in January was a clue of things to come. In February, AAPL hit a new all-time high on 13 days, or 65% of the trading days in that month! By the end of February, AAPL had hit $547.61, a gain of about $90 per share from the end of January. AAPL proceeded to hit a new high on 50% of the trading days in March, with the March top of $621.45. To date, AAPL has hit 4 more daily highs in April, topping out at $644.
There are some very important lessons from the above. First, if you refuse to buy or hold a stock at an all-time high, you will never ride a wonderful stock like AAPL. Second, if you want to find the next AAPL, begin by looking at the list of stocks that hit a 52 week high the prior day.  Then weed out the stocks that are not near their all-time high. Then research the remaining stocks’ fundamental and technical characteristics.
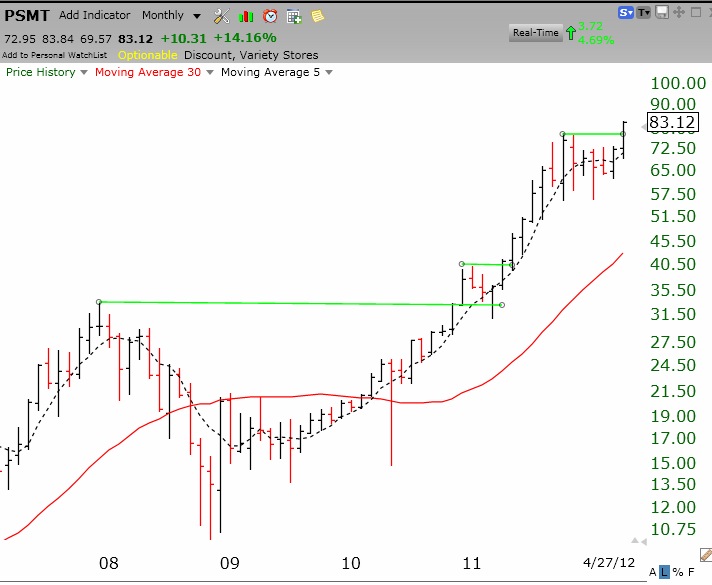
If my GMI has a buy signal, I concentrate solely on stocks at or near their all-time highs that have risen strongly for months and are now breaking out of multi-month consolidations. The best way to see such stocks is to look at their monthly charts. Here is an example of the type of stock that interests me. I bought some PSMT last week when it touched $80. This monthly chart shows the stock breaking out of a 6-7 month consolidation, coming after a 7 month rise when it doubled in price. I make a small pilot buy of such a stock and place a stop loss below the break-out level. If the stock continues to rise, I will add to my position and raise my stop. I love to pay more for a stock that I have already bought. I never average down. I found PSMT simply by using TC2000 to scan for all stocks that hit a new high and then charting their monthly price patterns. The fact that the stock was flagged as having appeared on an IBD 50 or New America list increased my confidence in the stock. Other stocks that hit a new high last week and that had promising monthly charts were: CF, DSW, WPI, ECL, LKQX, CB, KMB, ULTI, FDO, SBNY, GEOI. These are worth researching. I always check out whether earnings are imminent–I stay away from stocks that will report earnings soon…..
I am willing to go long again because the GMI just issued a buy signal. I am slowly going long and have bought some QLD. I also sold some weekly cash secured puts on SPY. I am basically betting that the SPY will close next Friday above the strike price (140) on the put options that I sold. If I am wrong, I will have to buy back the puts at a higher price, or buy the underlying SPY shares at the strike price. I feel comfortable with these short term bets on the SPY as long as the GMI is bullish. Furthermore, the SPY is about the only thing I would be willing to have put to me. I do not do this with individual stocks that can be much more volatile. If I can pocket a premium of 1/2 to 1% each week, it gives me a nice monthly return on my money….
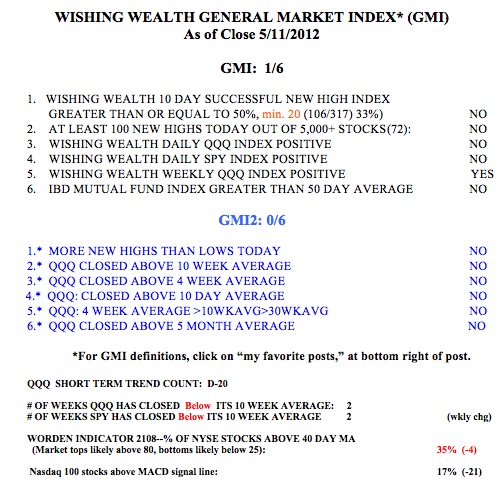
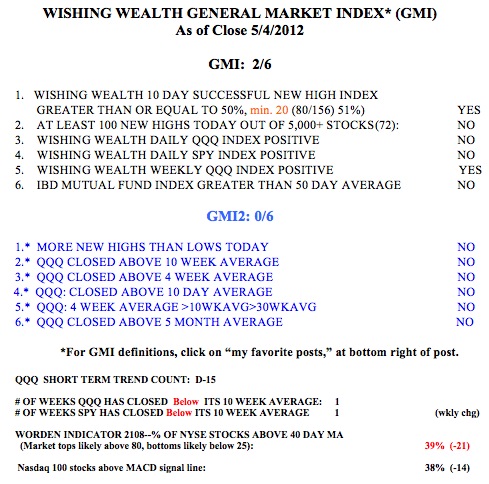
The GMI is now at 5 and the GMI2 is at 6. The GMI was >3 for two consecutive days, which is my criterion for a buy signal. 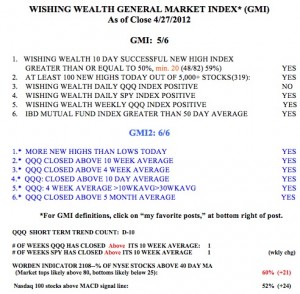 So I am closing all shorts and going long in my trading account. The Daily QQQ Index component of the GMI will turn positive with an up or flat day on Monday. I use a very stringent criterion for a change in the short term trend of the QQQ. Thus, Friday was the 10th day of the QQQ short term down-trend, within a longer term up-trend. I will be much more confident of the new up-trend once it lasts 5 days. The QQQ and SPY have now closed above their 10 week averages, an important sign of strength. 52% of the NASDAQ 100 stocks closed with their MACD above its signal line, another sign of a strengthening market. The Worden T2108 Indicator is in neutral territory, at 60%. IBD continues to see the market in a confirmed up-trend…..
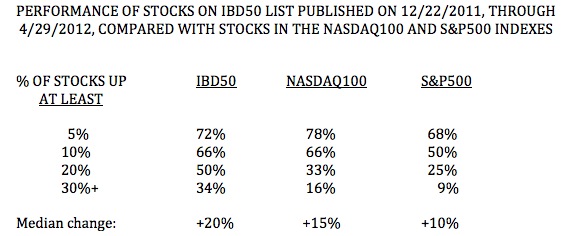
Over the years I have investigated how well the IBD100, now IBD50, stocks perform versus other groups of stocks. The stocks that meet the IBD growth criteria usually outperform other stocks in a rising market, but under-perform in a falling market.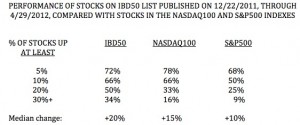 I replicated my past analyses by looking at the performance of the IBD 50 stocks published on 12/22/2011 at the beginning of this year’s rise, through last Friday. The IBD50 stocks did much better than the NASDAQ 100 stocks or the S&P500 stocks. The median change in the IBD50 stocks was +20%, compared with +15% for the NASDAQ 100 stocks and +10% for the S&P 500 stocks. Moreover, the IBD 50 stocks really shined when looking at the likelihood of a larger ,+30% gain. 34% of the IBD 50 stocks gained 30% or more, compared with only 16% of the NASDAQ 100 stocks and 9% of the S&P500 stocks. Clearly, the IBD selection criteria resulted in a lot more winners than one would find among the stocks in these other two indexes. That is why I focus largely on watch lists and scans containing stocks that have appeared on IBD 50 stock lists published every Monday.
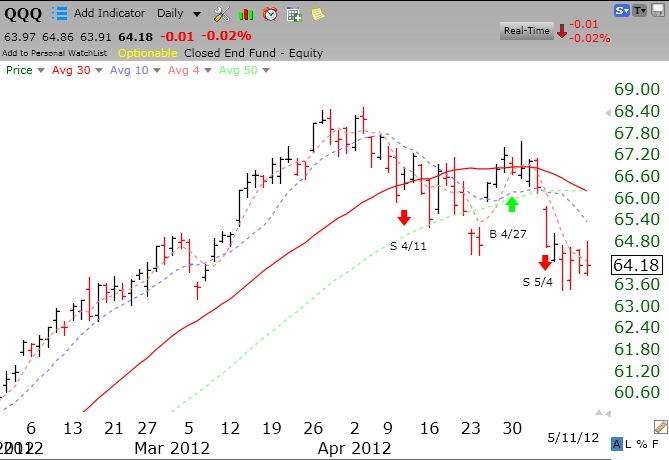 The down-trend in gold has also become stronger. As this daily chart of the QQQ shows, the 30 day average (red line) is now curving down and touching the 50 day average (green dots), and the shorter term, 4 and 10 day averages, are now declining below the important 30 day average. Compare the pattern of the past few weeks with that of the preceding time period. It does not take a skilled technician to see that the market is no longer in an up-trend. The AAPL chart is very similar to this one. The leaders are no longer charging ahead. This is no time to be brave……