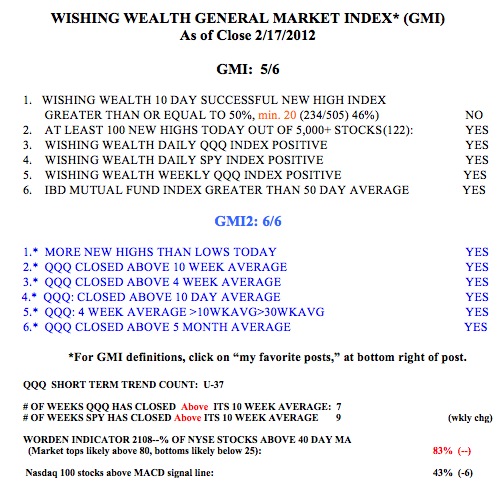
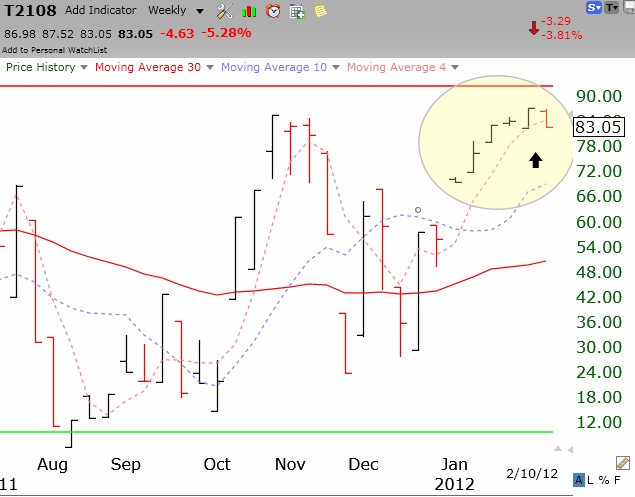
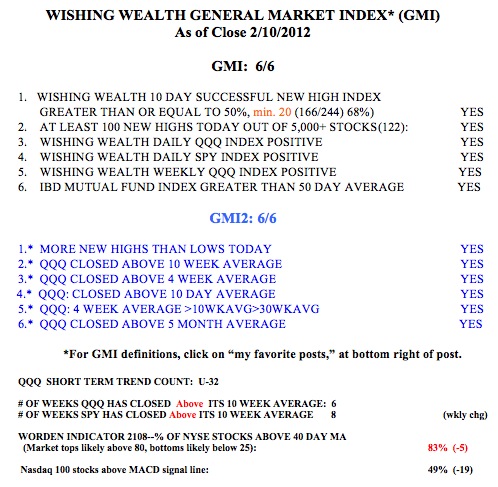
QQQQ short term up-trend completes 5th day; Majority of advisers bullish; RWB rocket: SPRD

GMI4/6
GMI-R7/10
T210850%

On Friday, the new QQQQ short term up-trend completed its 5th day.   Usually, once an up-trend turns 5, it lasts quite a bit longer. But the GMI is only 4, reflecting some weakness in the S&P500 (SPY) stocks.   I am also a little concerned by the fact that the Investor’s Intelligence Survey on last Tuesday showed 55.7% of advisers being bullish on the market.   This is a good contrary indicator, and in the past when the bullish percentage approached 60%, the market was near a top. So, we need to watch this survey and the market very closely.   The QQQQ and SPY have closed above their 10 week averages for 13 straight weeks. I have found that as long as the QQQQ closes above its 10 week average, I can trade the tech stocks profitably.   So, this is another indicator I monitor. The Worden T2108 indicator is at 50%, in neutral territory. The percentage of Nasdaq100 (QQQQ) stocks closing with their MACD above its signal line more than doubled last week, to 29%. This is a sign of short term strength. The GMI is now at 4 (of 6), and the more sensitive GMI-R is at 7 (of 10, click on Table to enlarge).

Below is a weekly GMMA chart of another RWB rocket stock, SPRD. All of the short term averages (red) are well above the rising longer term averages (blue). SPRD is close to its all-time high of $17 reached in November, 2007. A close above $17 would be a sign of strength for me and a potential buy signal, if I were interested in acquiring it.

Short term trend uncertain

GMI5/6
GMI-R7/10
T210857%

We had a one day down-trend last week after the 51 day up-trend ended and now we are back to the first day of a new QQQQ short term up-trend (U-1, click on table to enlarge). The index could go either way.   But the QQQQ and SPY longer term trends remain up, having closed above their 10 week averages for 12 straight weeks. So my long term university pension funds remain in mutual funds.   My trading accounts are mostly in cash or in QLD (the ultra long QQQQ ETF) right now.   The   stochastics for the QQQQ reached oversold levels last Thursday and the market rallied. I need to see if this rally can hold on a few more days to be confident of this new short term up-trend.   Note that only 12% of the Nasdaq 100 stocks closed Friday with their MACD above its signal line, suggesting short term weakness. The T2108 indicator, at 57%, is in neutral territory, but the Investors Intelligence poll   shows few bears and many bulls.

Length of QQQQ short term up-trend nears recent peaks; Decreasing leverage

GMI5/6
GMI-R8/10
T210863%

I did an analysis of the length of all of the QQQQ short term up-trends (as defined by me) going back to July, 2006.   Including the current up-trend, there have been 25.   Six (24%) of these past 25 up-trends lasted for more than 50 days.   Of these 6 longest up-trends, 4 lasted between 50 and 59 days and two lasted more than 60 days (86 and 80 days). So this tells me that given that the current QQQQ short term up-trend completed its 49th day on Friday and it would take a minimum of 2 more days (for my indicator to turn negative) to end the up-trend, we are in   the vicinity of where most of the longest short term up-trends have ended.   Now, I am the first to say that anything is possible in the market and precedents are meant to be broken.   But I like the odds to be on my side. Given that the QQQQ has risen almost nonstop since early September (almost +15%), it may be a good time for me to take off some of the leverage inherent in my call options now and to get ready to exit my swing positions if the trend turns down.   I am not exiting my longer term university pension mutual funds because the longer term up-trend remains intact and any short term down-trend could be quite short.

The GMI has declined one, to 5 and the more sensitive GMI-R two, to 8. (Click on chart to enlarge.) The SPY and QQQQ have closed above their critical 10 week averages for 11 weeks. Note that the Worden T2108, an indicator that acts as a pendulum of the market, has declined to 63%. This means that only 63% of NYSE stocks are above their 40 day moving averages, and that the market is now out of the area where market peaks occur.   On the other hand, the T2108 is far above the level (below 20%) where market bottoms tend to occur. Another sign of weakness is that only 35% of the Nasdaq 100 stocks closed with their MACD above its signal line.

I am not looking to take on new positions now, but I will buy an inverse (bearish) index ETF if the QQQQ enters a short term down-trend.