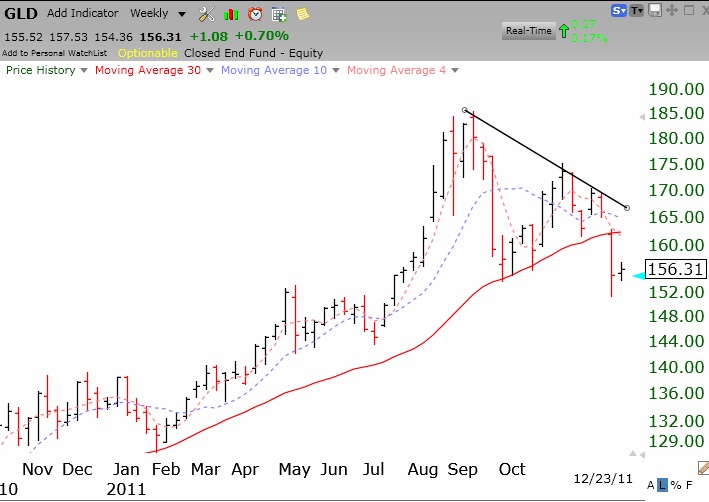
On December 23rd, the GMI flashed a buy signal. 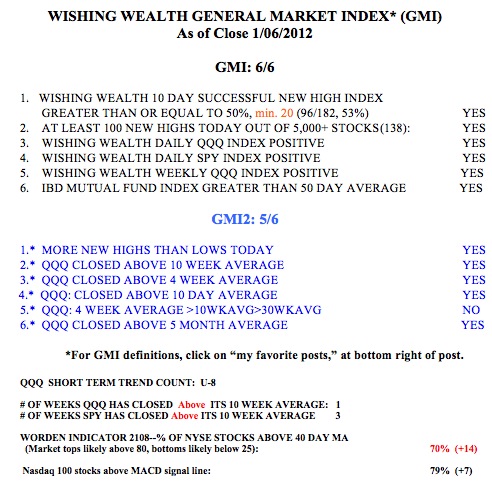 I remain invested long in my university pension and hold several long positions in my trading accounts. AAPL has helped to drive the Nasdaq 100 index (QQQ) higher. GLD may be reaching the end of its rebound from oversold levels. With its stochastic at 89, I am looking for signs of a reversal before I short GLD.
General Market Index (GMI) table
GMI at 6; WishingWealth GMI rocks; Gold in decline
The GMI remains at 6 and there is still a bullish signal in place. I reviewed the performance of the GMI during this break and found it to have performed quite well since I began posting it in 2006. 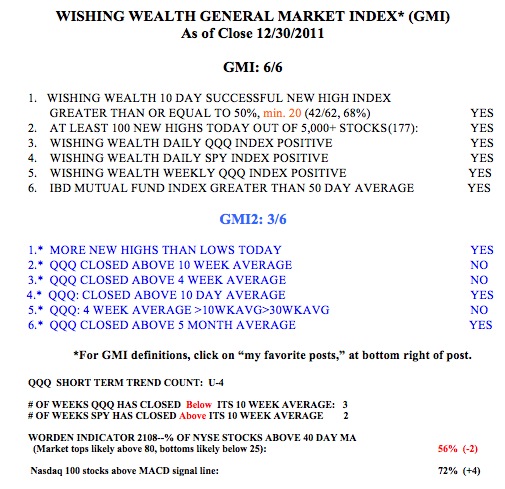 I will eventually publish the findings. For now, I will just say that the WishingWealth General Market Index (GMI) handily beat a buy and hold approach while reducing risk by keeping me out of the market during the major declines in this period. I will present the data and the key decision rules that I used, in my presentation at the Worden 2012 Conference in DC in April.
Meanwhile, the QQQ short term up-trend has now reached 4 days (U-4). Nevertheless, the QQQ has closed below its critical 10 week average for 3 weeks. In contrast, the SPY has closed above its 10 week average for 2 weeks. So, the large cap index has been outperforming the tech stocks, for now. The Worden T2108 indicator is at 56%, in neutral territory, and 72% of the Nasdaq 100 stocks closed with their MACD above its signal line, a sign of short term strength. However, the daily stochastic for the QQQ is nearing the overbought range and I think this two week rebound from oversold may be coming to an end. With the GMI-2 at 3, I remain cautious now with only a few hedged long positions. My university pension still remains invested in mutual funds, for now.
If you want to see why I am bearish on gold, take a look at this daily GMMA chart of GLD.
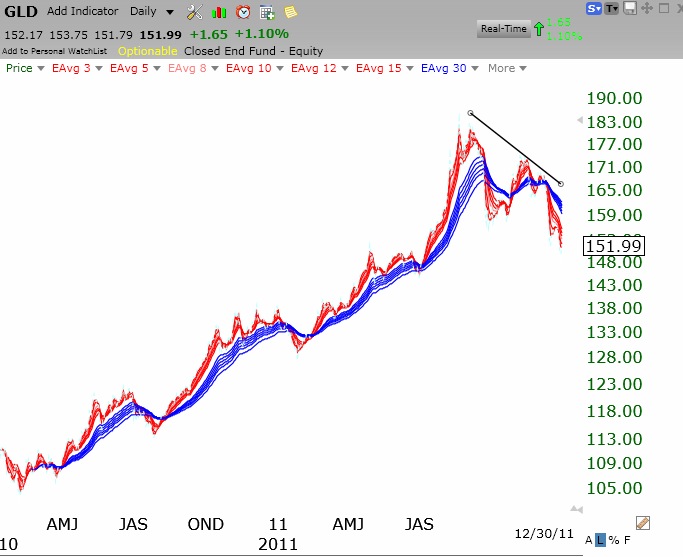
(Click on chart to enlarge.) Note that the short term averages (red) are far below the longer term averages (blue). Prior recent support levels have been broken. The multi-year up-trend has likely ended and I own a put option on GLD.
GMI posts bullish signal; QQQ still in short term bounce; Gold begins Stage 4 decline?
With the GMI at 5 and above 4 for two consecutive days, this indicator is flashing a bullish signal. I will be more comfortable if the QQQ holds on Tuesday and its short term trend turns up too. 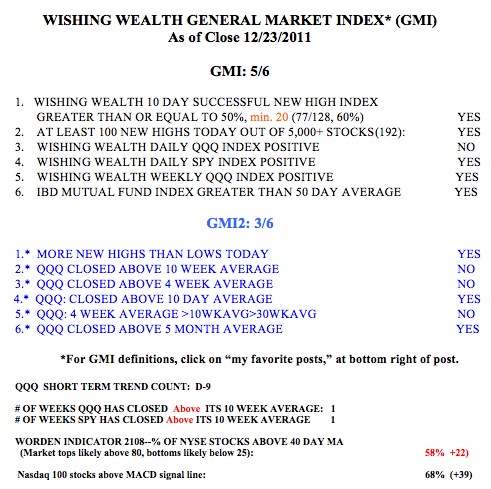 The Worden T2108 indicator is in neutral territory, at 58%. 68% of the Nasdaq 100 stocks closed with their MACD above its signal line, a sign of short term strength. Only 25% of the Nasdaq 100 stocks have an over-bought stochastic, compared with 53% of the Dow 30 stocks. This difference reflects that the large cap stocks are currently out-performing the tech stocks. As I wrote previously, after a weak market people tend to feel more comfortable buying the big blue chip stocks than the more speculative growth stocks reflected in the QQQ. The smaller growth stocks take off later, once people have profits. Both the QQQ and SPY are back above their respective 10 week averages, a sign of strength.
The QQQ reached a short term oversold level on December 19, and has bounced off of that level the past 4 days. The QQQ is getting close to an overbought level, as measured by stochastics and Bollinger Band indicators I use. I am therefore planning to move my stops up and/or write calls on my few long positions as soon as these indicators become over-bought. Over the past year, the QQQ has cycled between over-sold and over-bought. I am therefore not adding to any long positions right now. I am still looking to short gold once the consolidation from the recent sharp drop is over. This could take weeks. Check out this weekly chart which shows GLD now firmly below its 30 week average (red line) and entering a major Stage 4 decline. Click on weekly chart to enlarge.