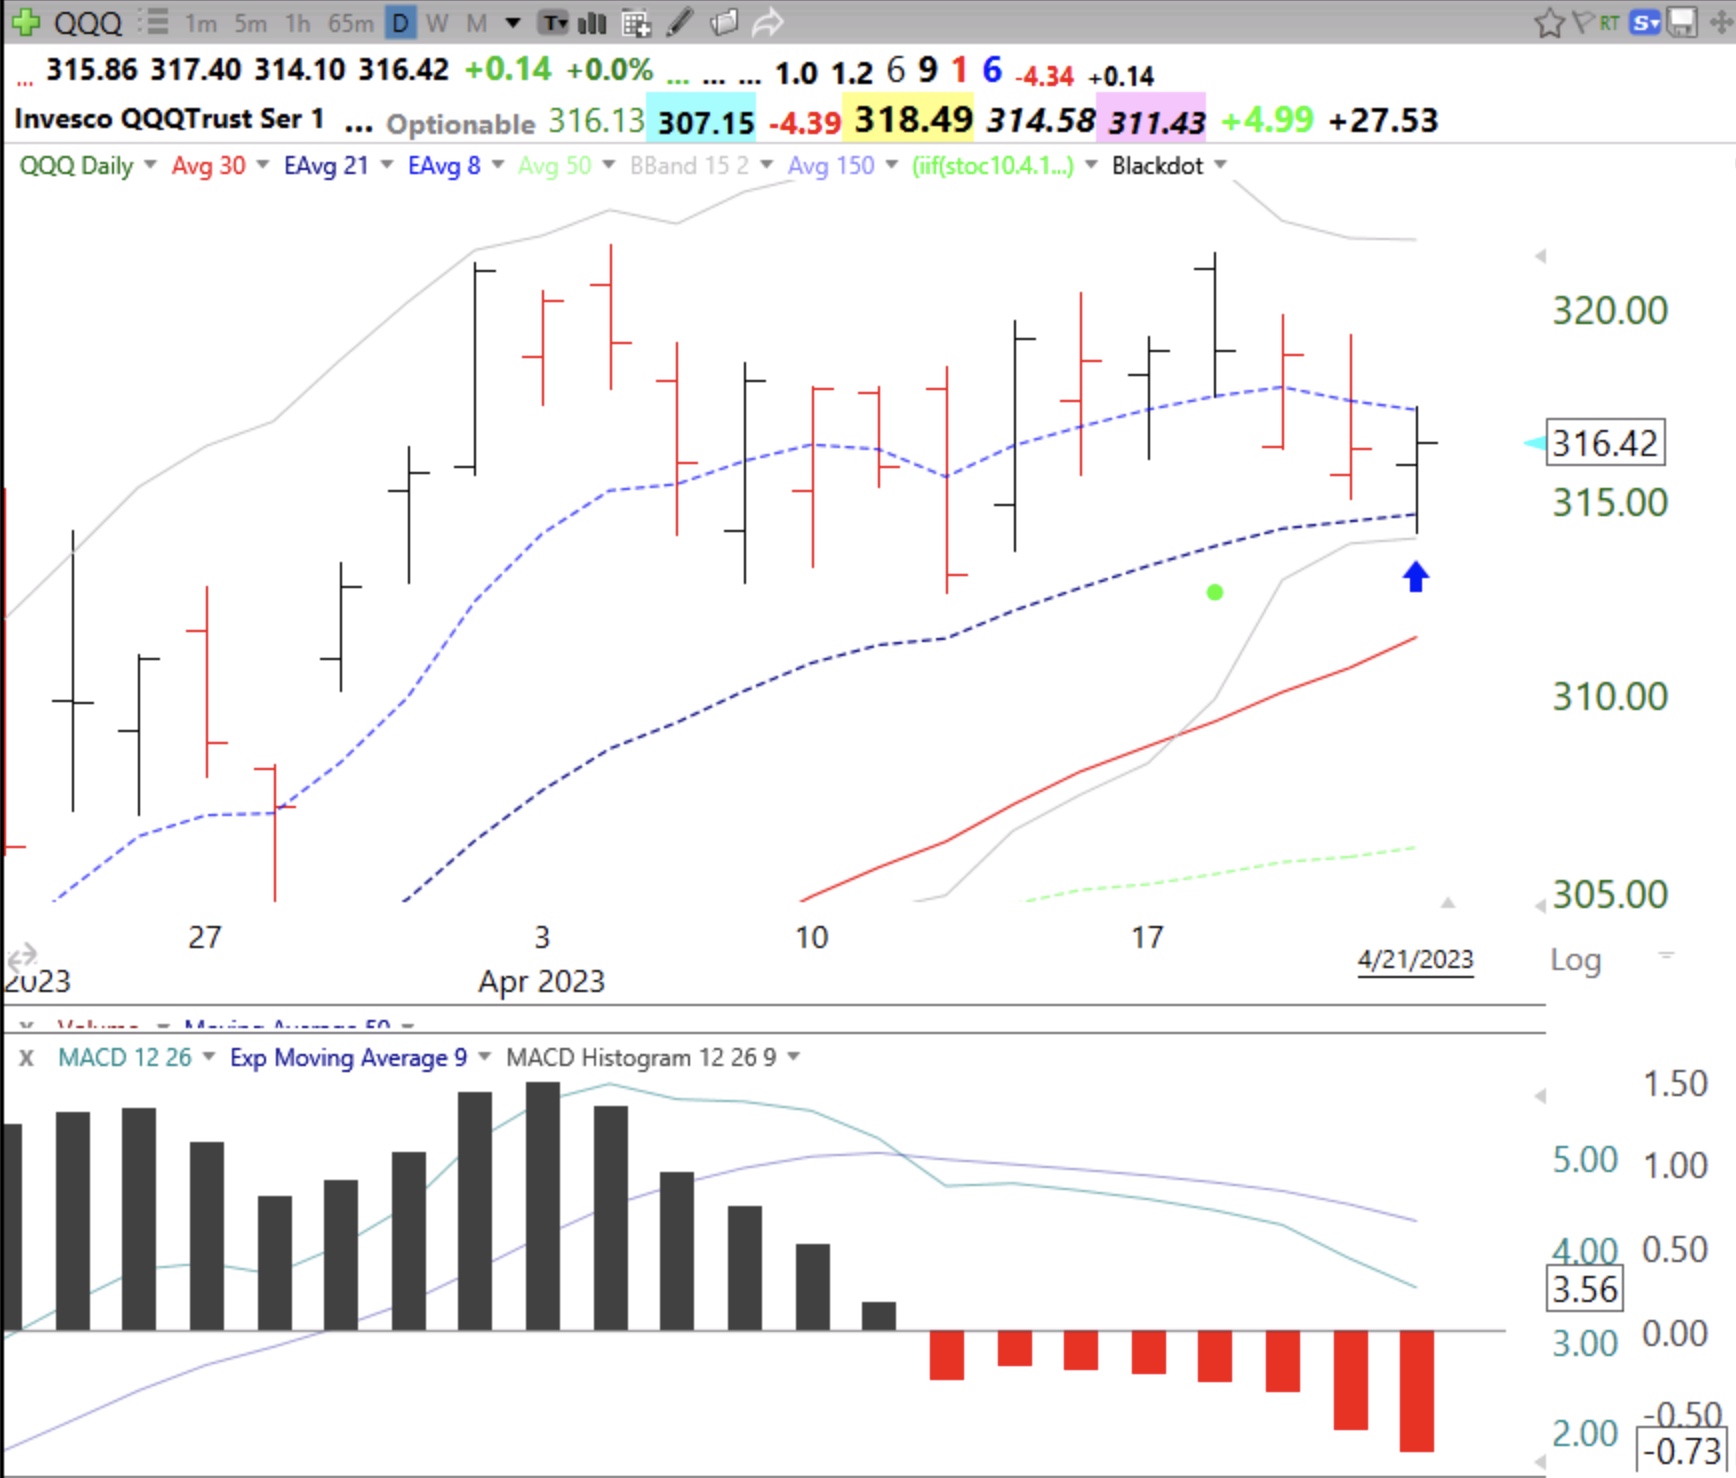
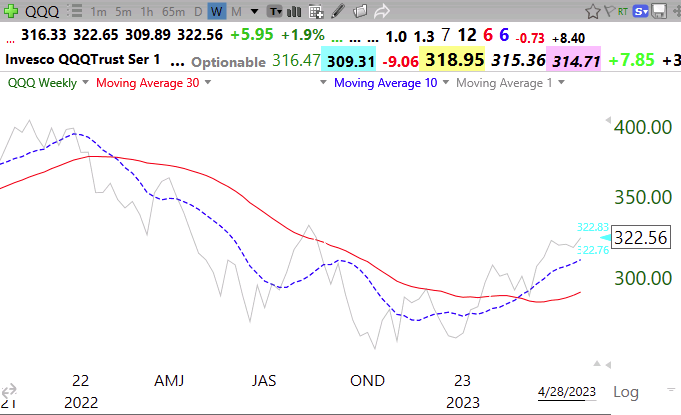
We had an unusual 2 day long new QQQ short term down-trend last week. I had noted that 40% of short term down-trends last 5 days or less but this was a rare, very brief one. And the GMI came close to turning Red las week, but held. My 10:30 weekly chart below shows QQQ (and also DIA and SPY, not shown) remains with its 10 week average above its 30 week average. And now the 30 week average is turning up, a powerful sign of a beginning Stage 2 up-trend. This is the pattern of new longer term up-trends.
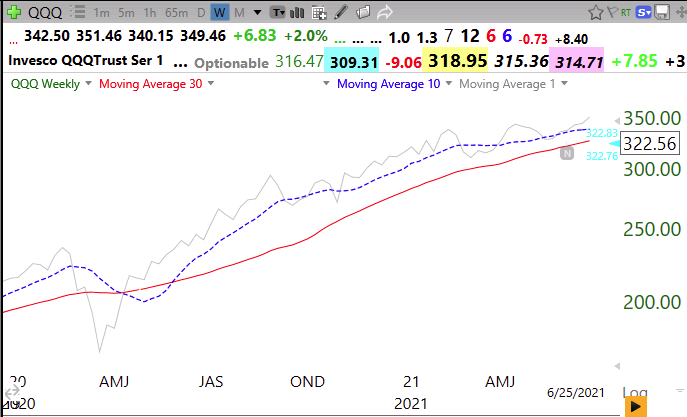
Here is the bottom in 2020.
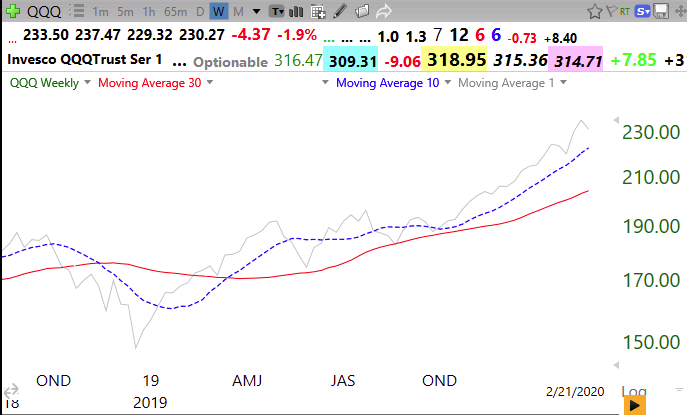
And in 2019
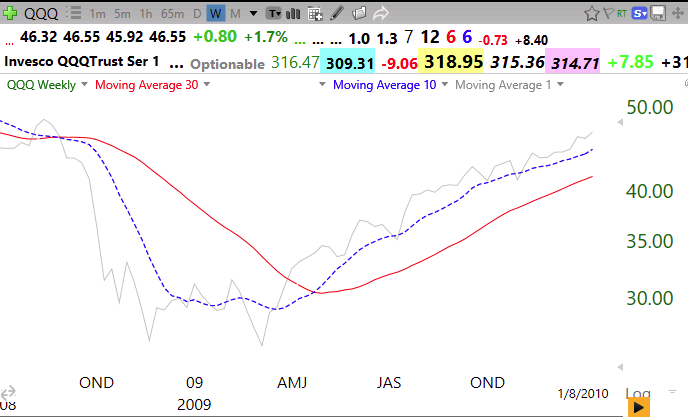
And in 2009
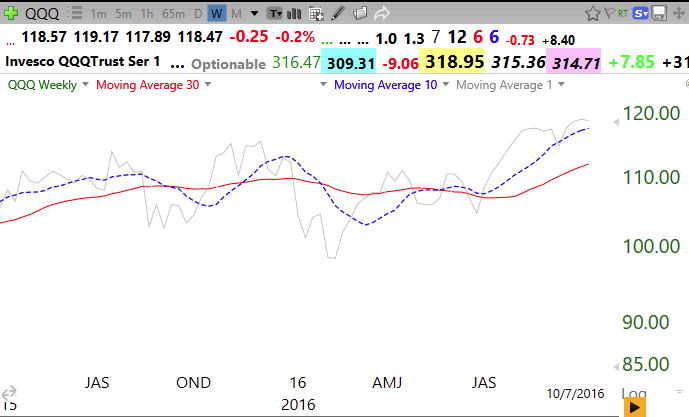
But this whipsaw pattern happened in 2016, indicating that past performance does not guarantee future results. No indicator is 100% perfect and we need to remain flexible and nimble. But to me, the odds favor a new major up-trend–until they don’t. If the index (gray line) closes the week back below the 30 week average (red line) is is an early sign of weakness and all bets are off.
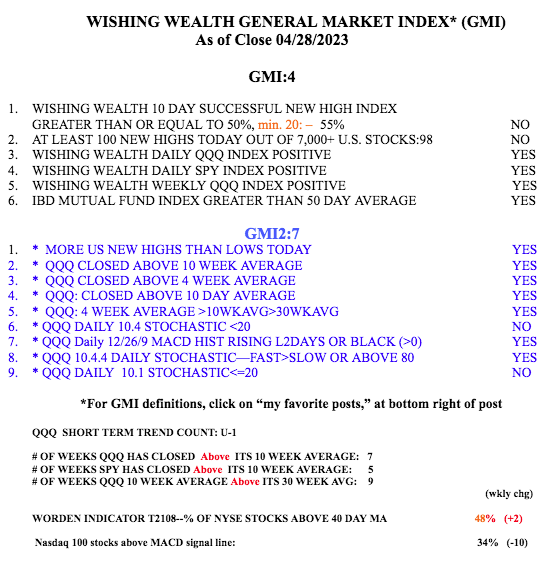
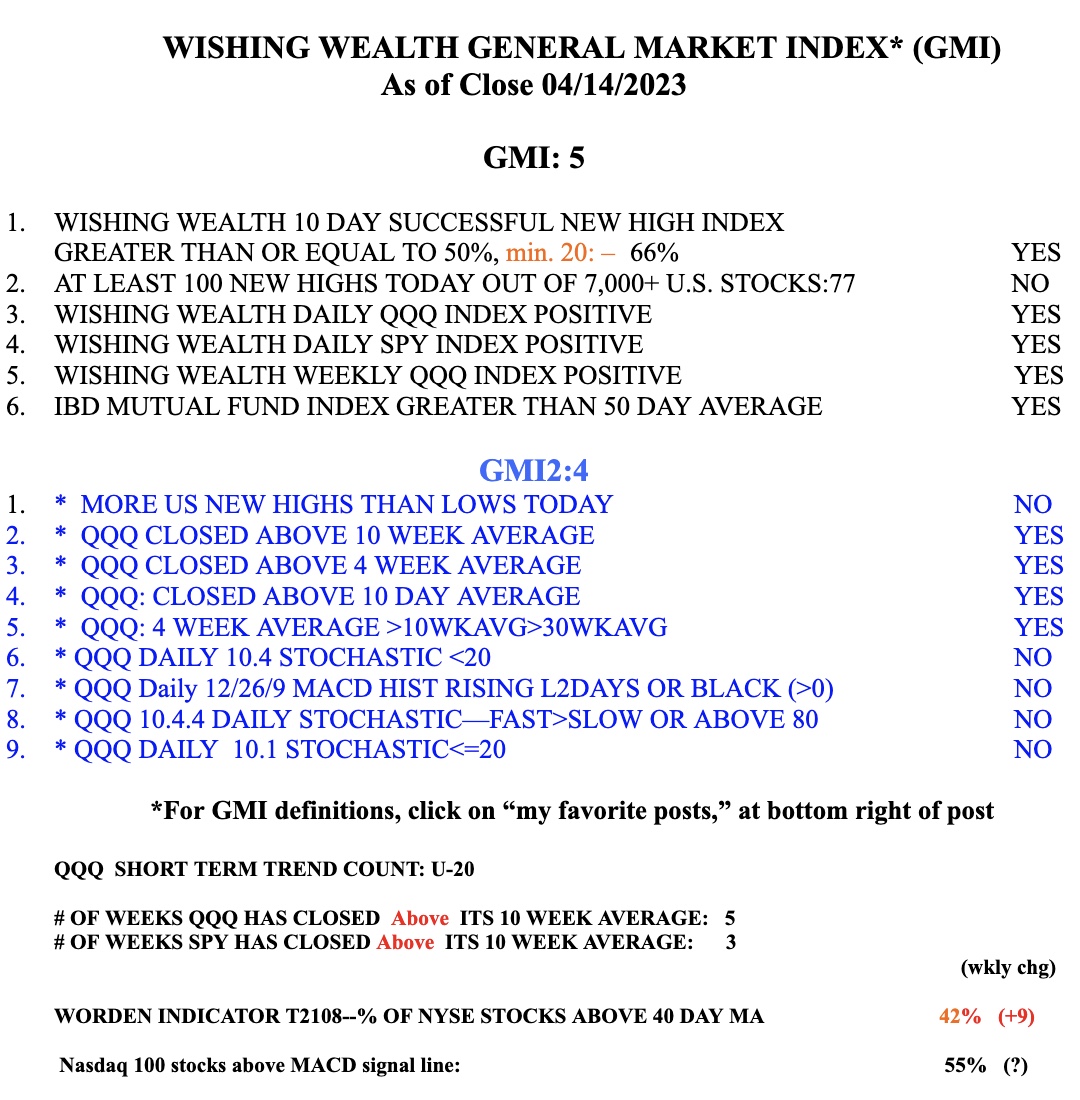
The GMI remains on a Green signal. I added a new statistic to the table: the number of weeks the QQQ 10 wk average has closed above its 30 wk average. This captures the prime signal of the longer term up-trend I noted in the 10:30 week charts I discussed above.