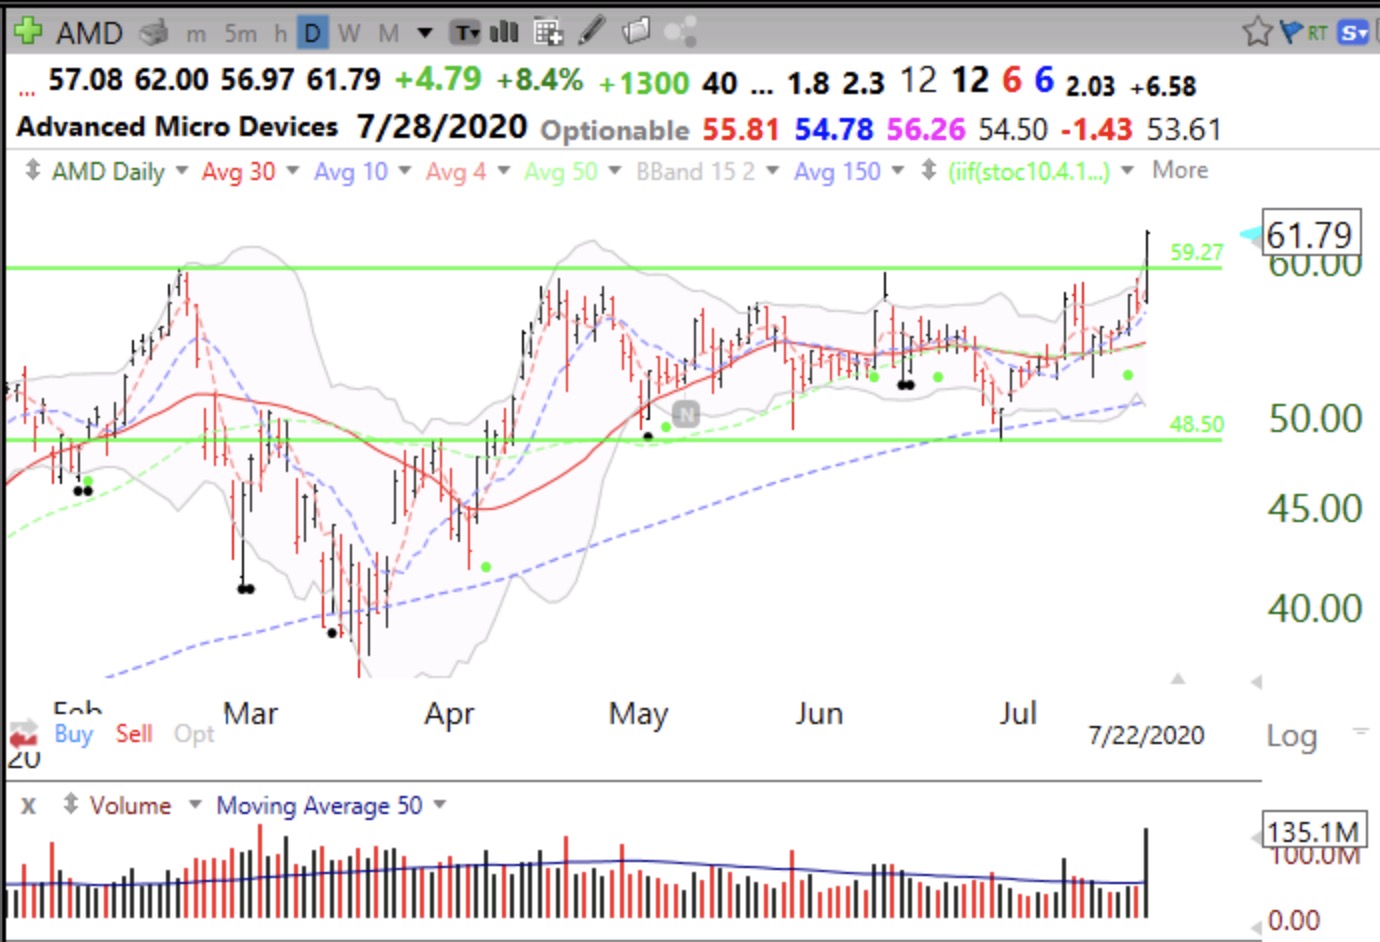
Almost all of the growth stock strategies my favorite trading gurus (Livermore, Darvas, O’Neil, Minervini) involved searching for strong growth stocks that have already appreciated as much as 100% in the past year, that have formed a base and then break out above the top of the base on greater than average trading volume. They often have different names for their bases: boxes, cup with handle, double bottom and volatility contraction. I coined the term green line break-out (GLB) to designate stocks that reached an ATH, rested at least 3 months and then breakout to a new all-time high (ATH) above the top of their multi-month base, the green line, on above average volume. I like to buy stocks breaking out of a base to an ATH. The problem with this approach is determining where to put a stop loss indicating the break-out has failed. The key to success in this game is controlling losses when a set-up has failed. When I buy a GLB, I sell immediately if the stock closes below its green line, but this can be far below the price I paid for it if the stock moved quickly through its green line.
I have been attracted more and more to an approach where I buy strong growth stocks that have rested and become oversold and then bounce up off of support. I have designed indicators in TC2000 that define an oversold stock and search for them. One of these indicators is the green dot signal where the low fast stochastic turns up and crosses above the slow stochastic. When I buy an oversold stock that is bouncing off of support I then immediately place a stop loss just below the recent low. In this manner I am able to minimize my losses. When I decide to buy such a stock I also make sure that support will not be too far from my purchase price so the possible loss will be low. The famous turtle traders always entered a trade thinking it would fail so they always were prepared with an exit strategy. Most successful traders say that 50% or more of their trades fail. The way to succeed in trading is to have many small losses and a few very large gains. I buy, place a stop loss, and then watch without emotion to see if it succeeds or fails. If it fails I am sold out and if it sets up again, I often buy it back. The shake out often sets up a nice subsequent advance.
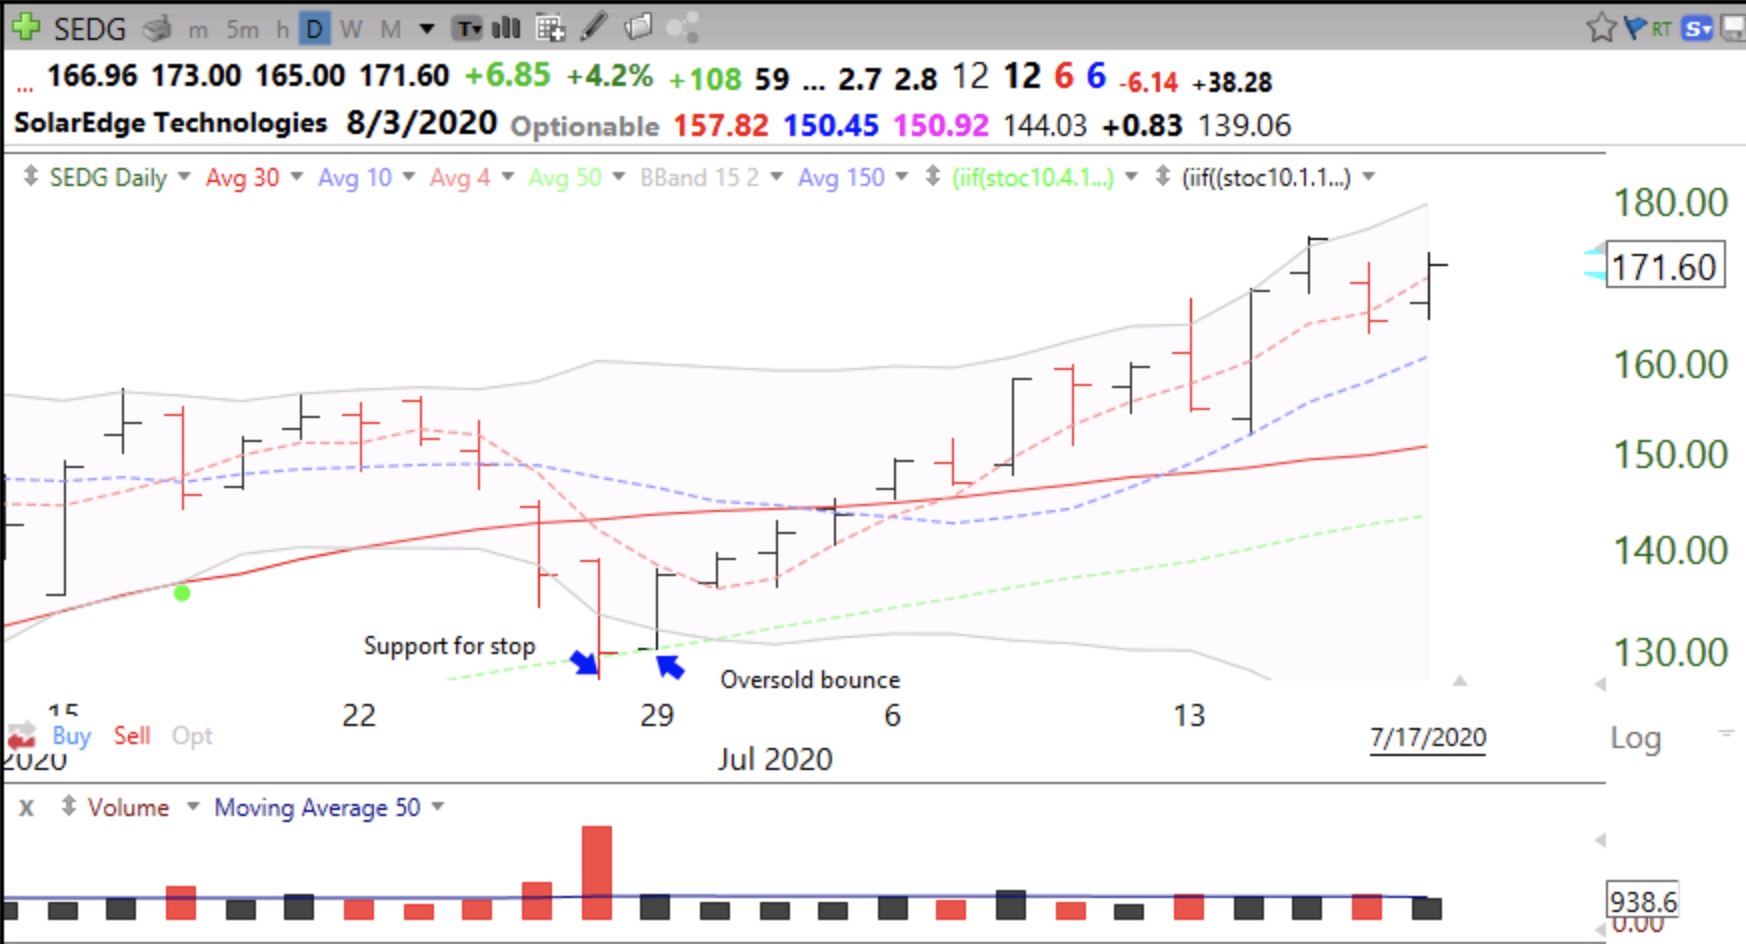
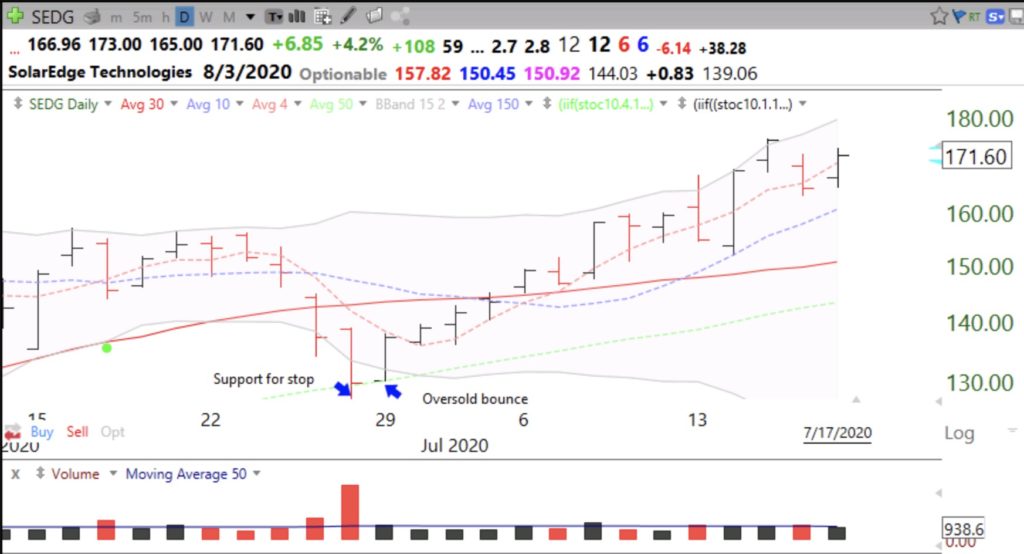
Below is an example of SEDG, which I traded using the strategy outlined above. Note the large volume down day before the bounce. That can be a good sign because the weak holders have sold to new holders and many traders may have shorted the stock as it fell, setting up a strong rebound when the stock starts to rise. The key is to wait for the bounce to occur and not jump the gun. The stock could just continue declining.
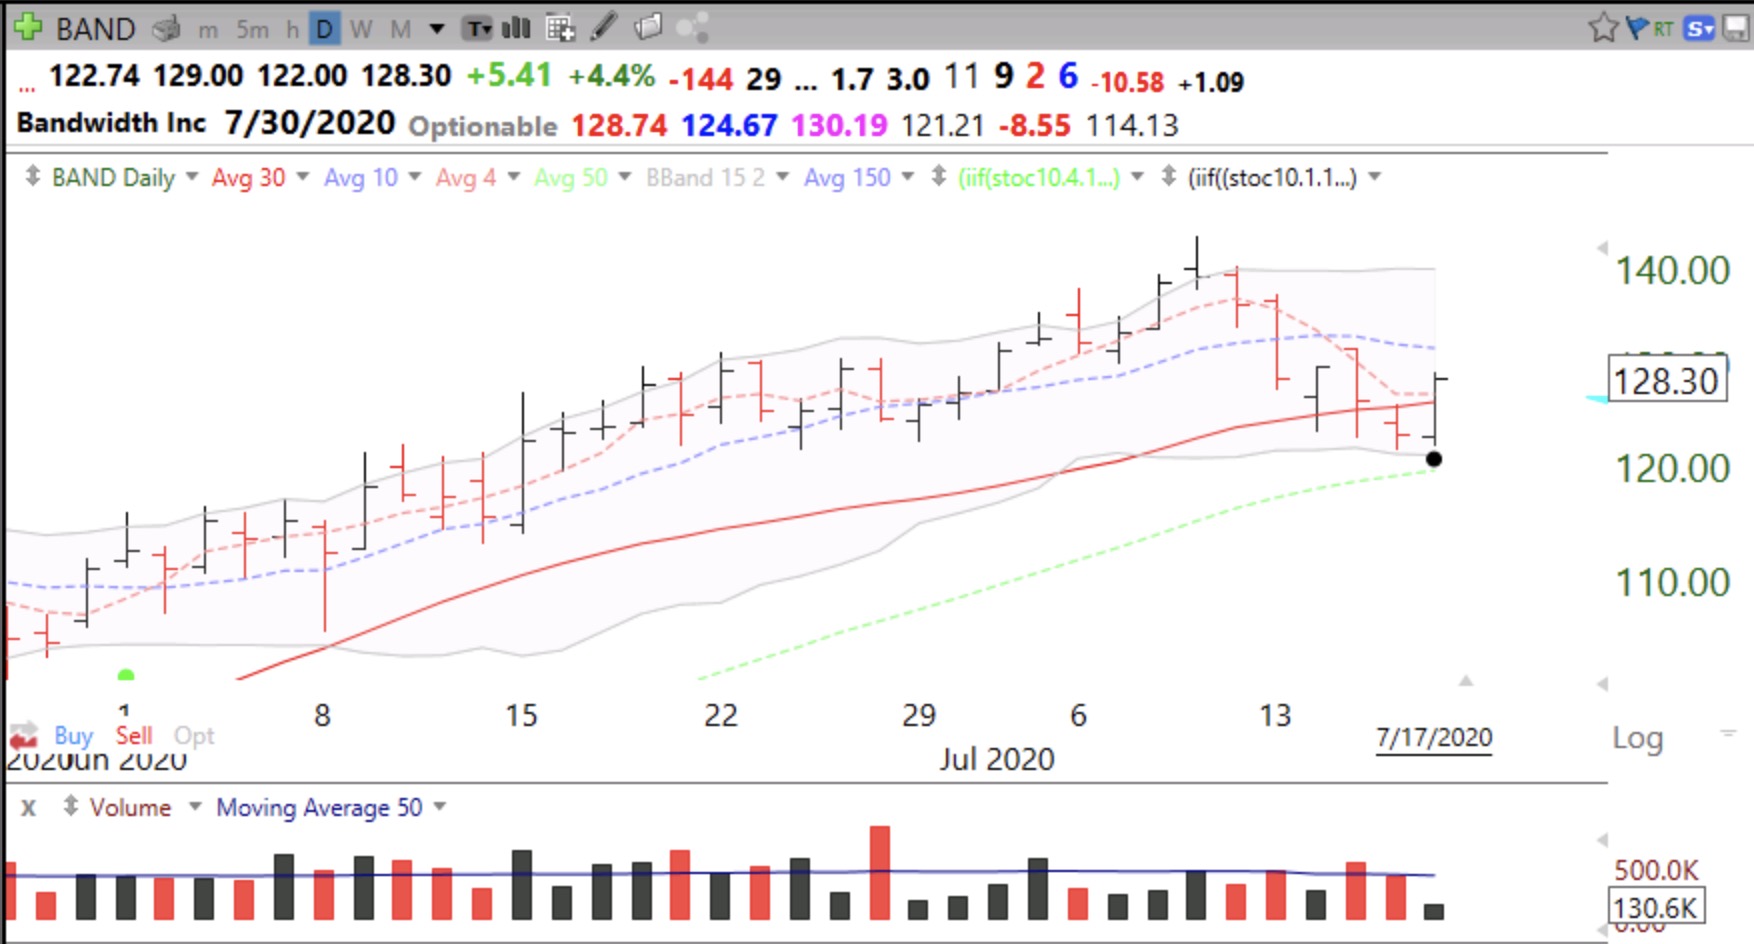
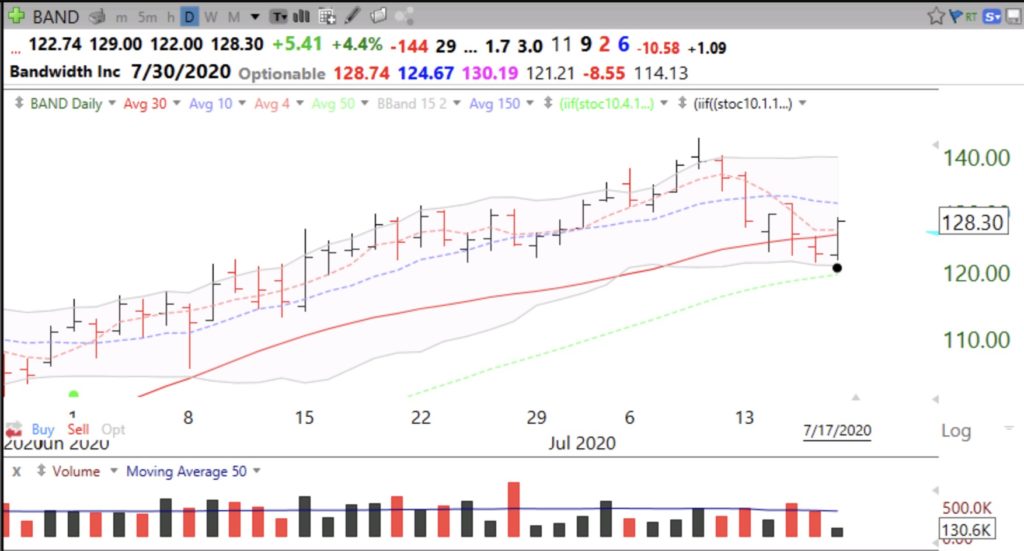
I ran a scan this weekend for advancing stocks that became oversold and are bouncing up off of support. I am not recommending the purchase of any of these. My goal is to educate my readers and students so they can learn the strategy and evaluate it for themselves. The stocks are: DDOG, ETSY, NET, BAND, PLMR, DOMO, CIEN, PING, ADBE, AYX, DSGX. Check out BAND. My GTC stop would be set below the low from the last 2 days (around 121.49) and hopefully, I would have bought it for less than where it closed on Friday.
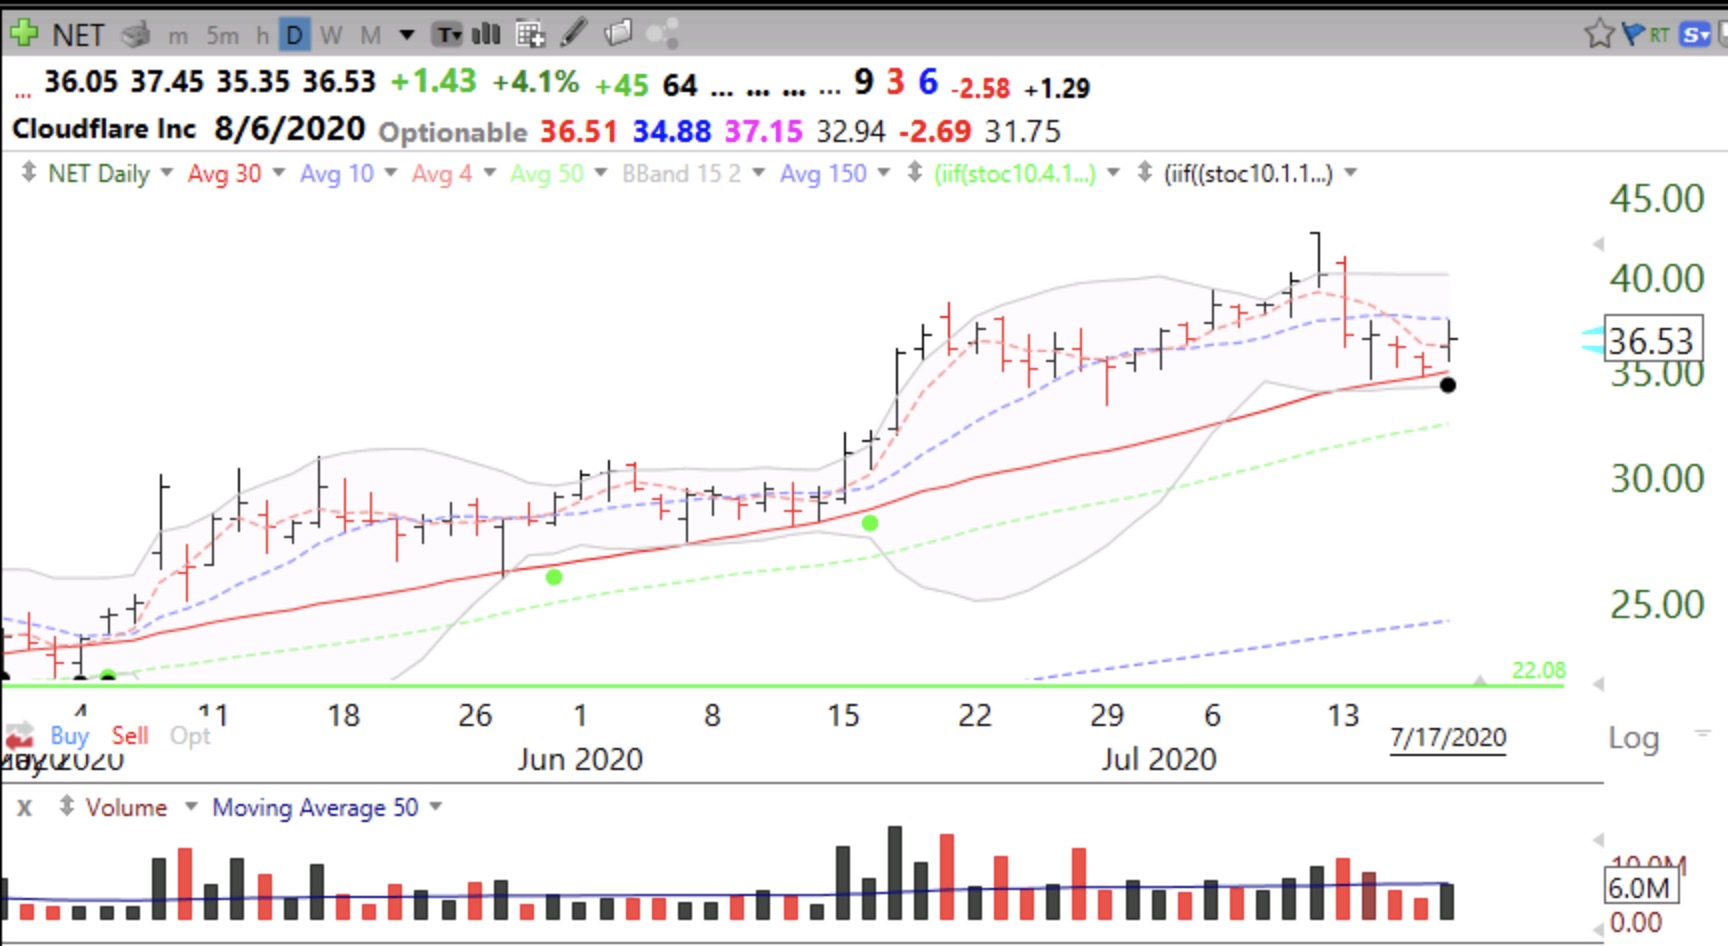
NET is another one. It has found support at its 30 day average (red solid line). My stop would be around 34.49.

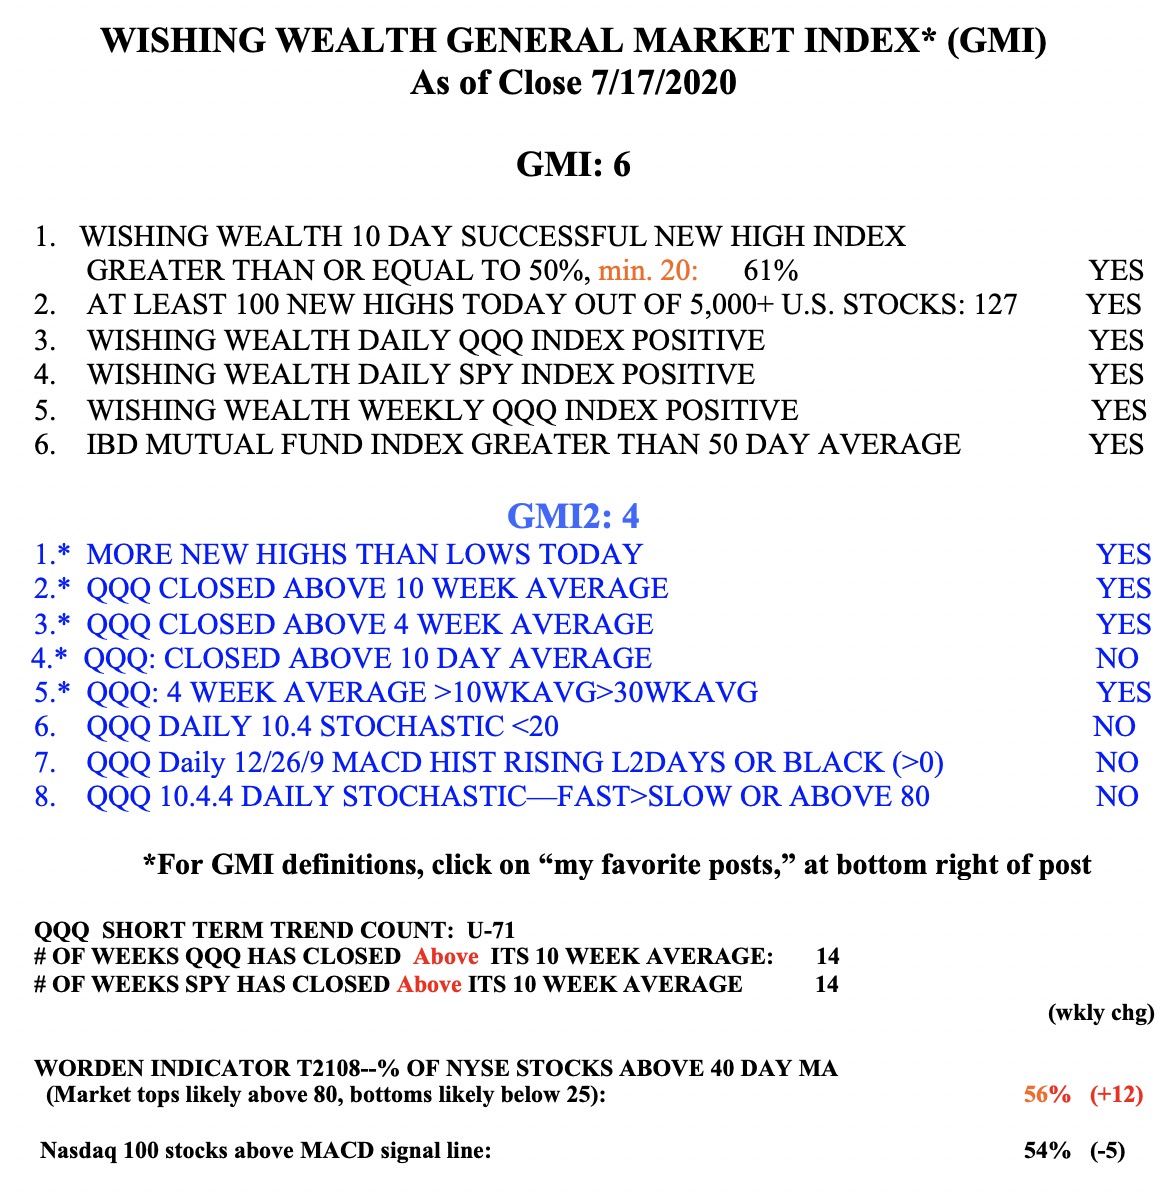
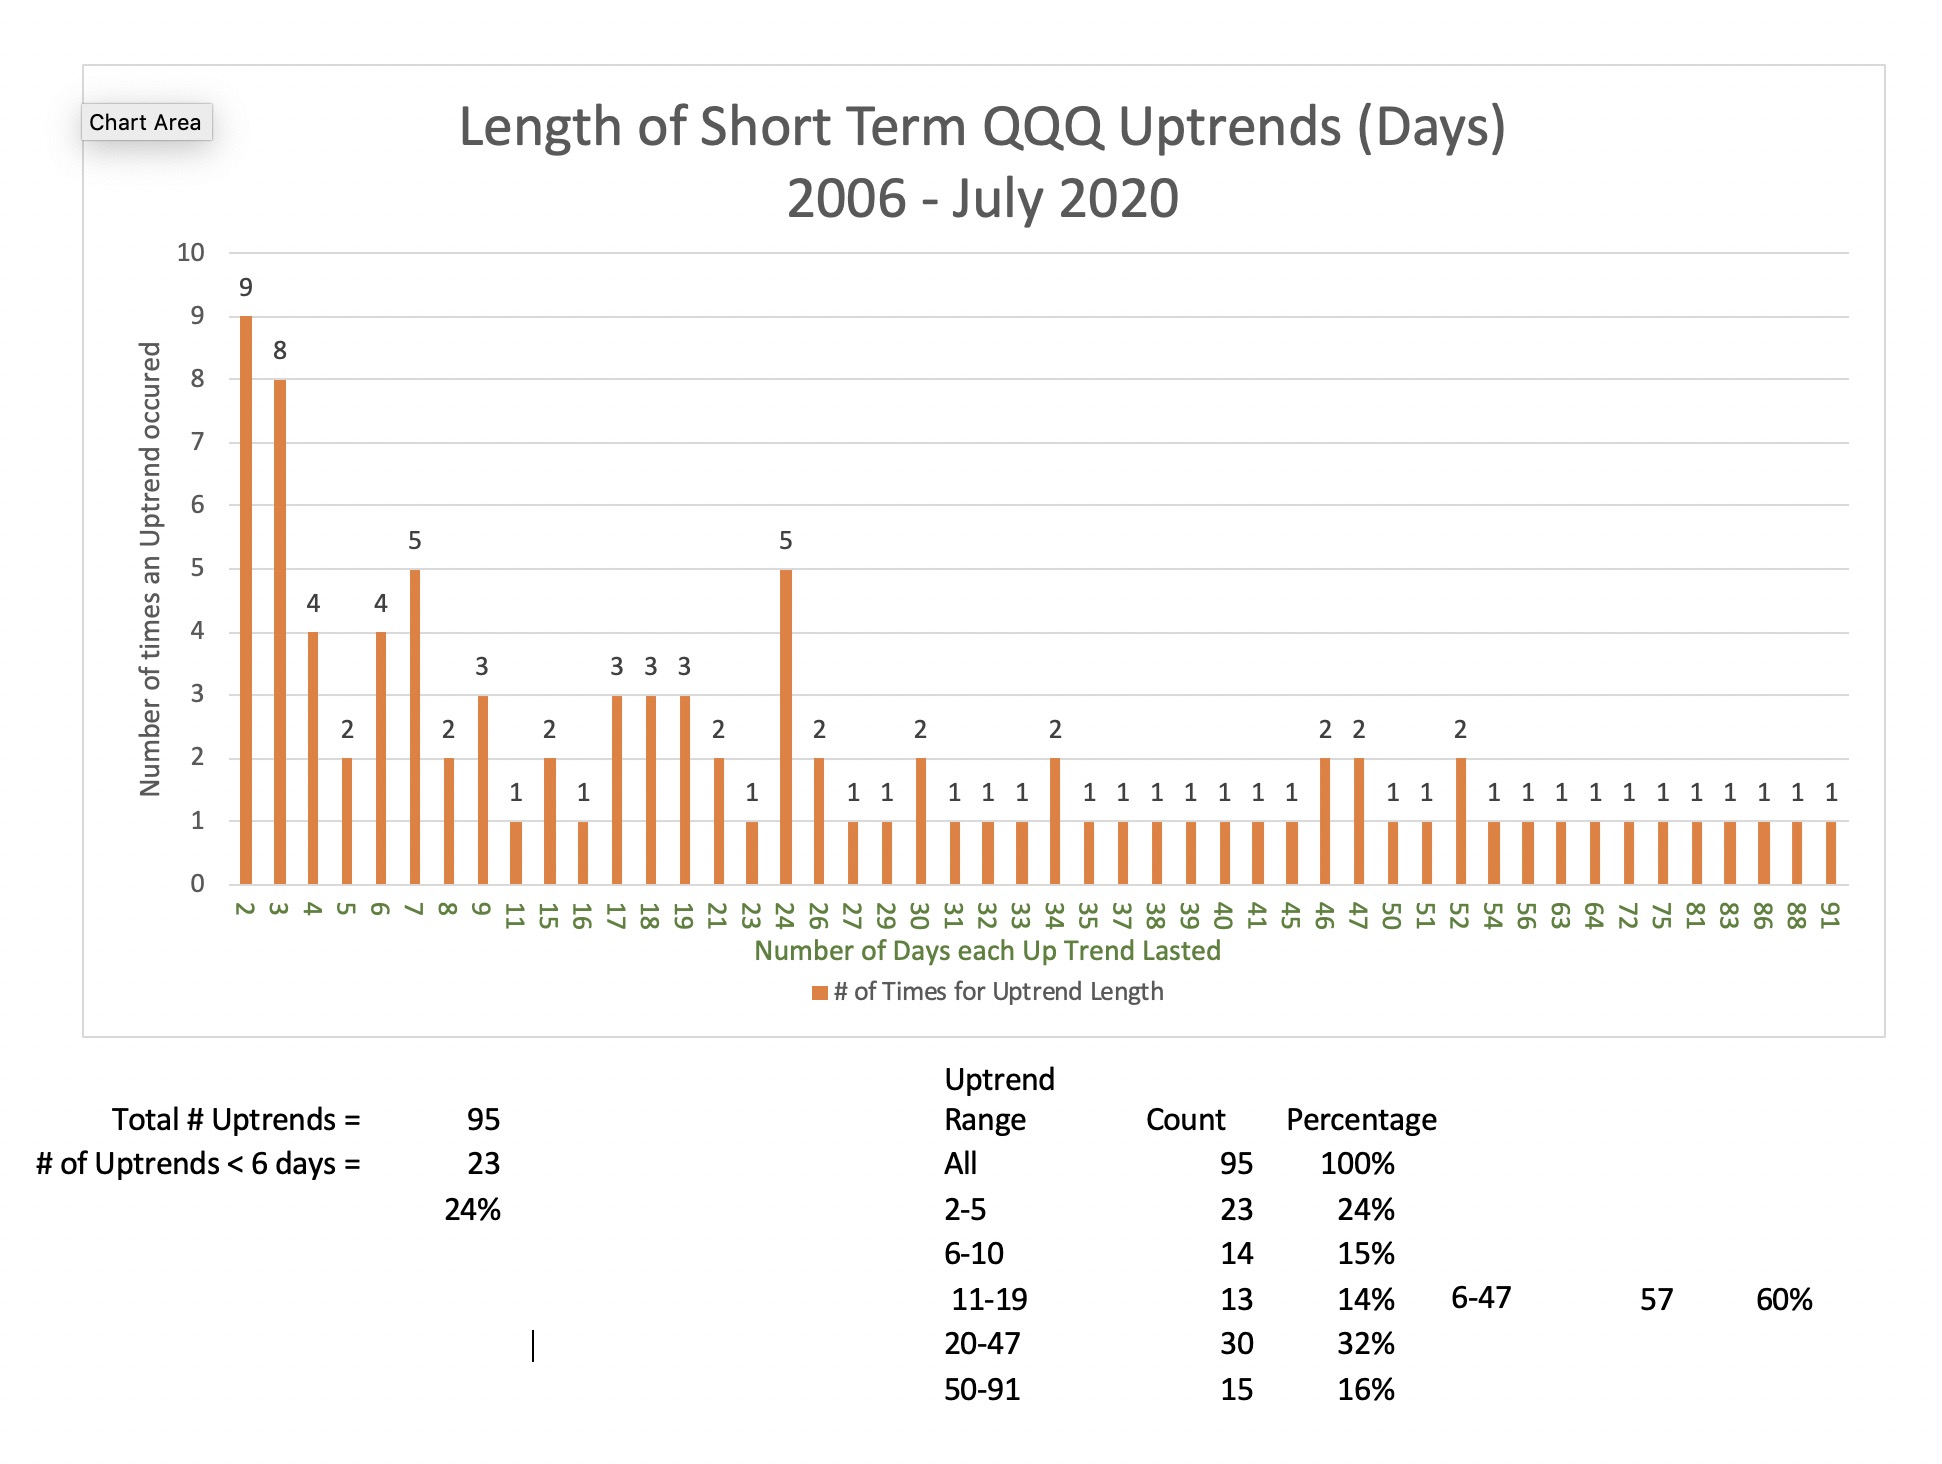
The GMI remains at 6 (of 6). But the QQQ short term up-trend is 71 days old and the short term sensitive GMI-2 is now 4 (of 8).