By the way, if you search Dr Wish on youtube you can find my TraderLion workshop presentation and a tutorial on putting my green and black dot signals on TC2000 charts. Look for Rising Stochastic Indicators tutorial just completed by my co-instructor.
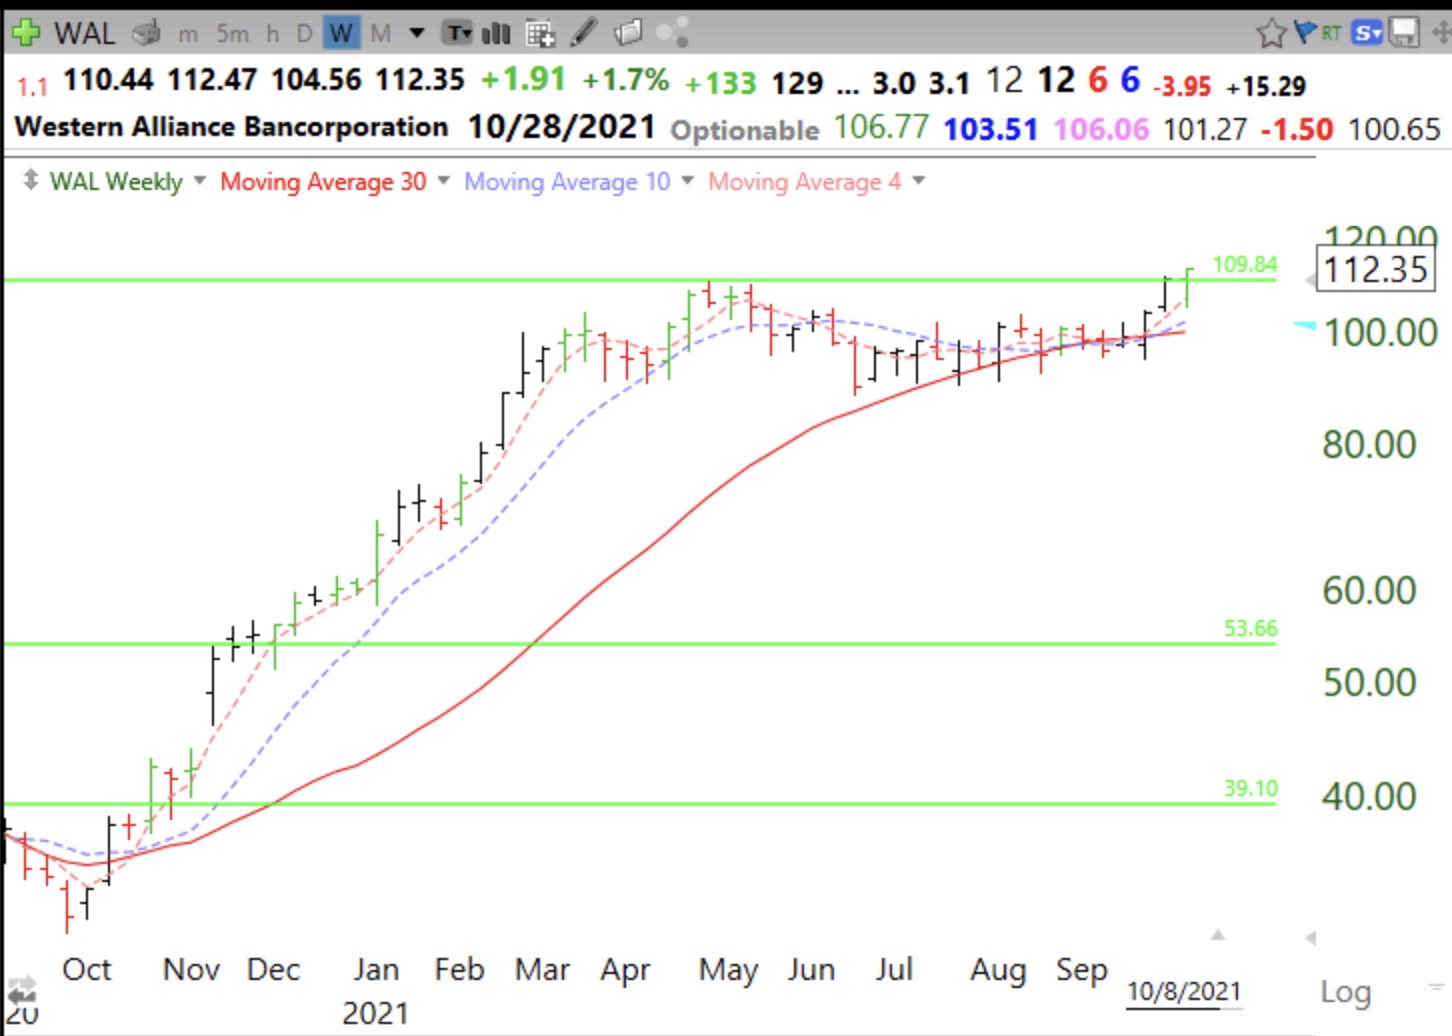
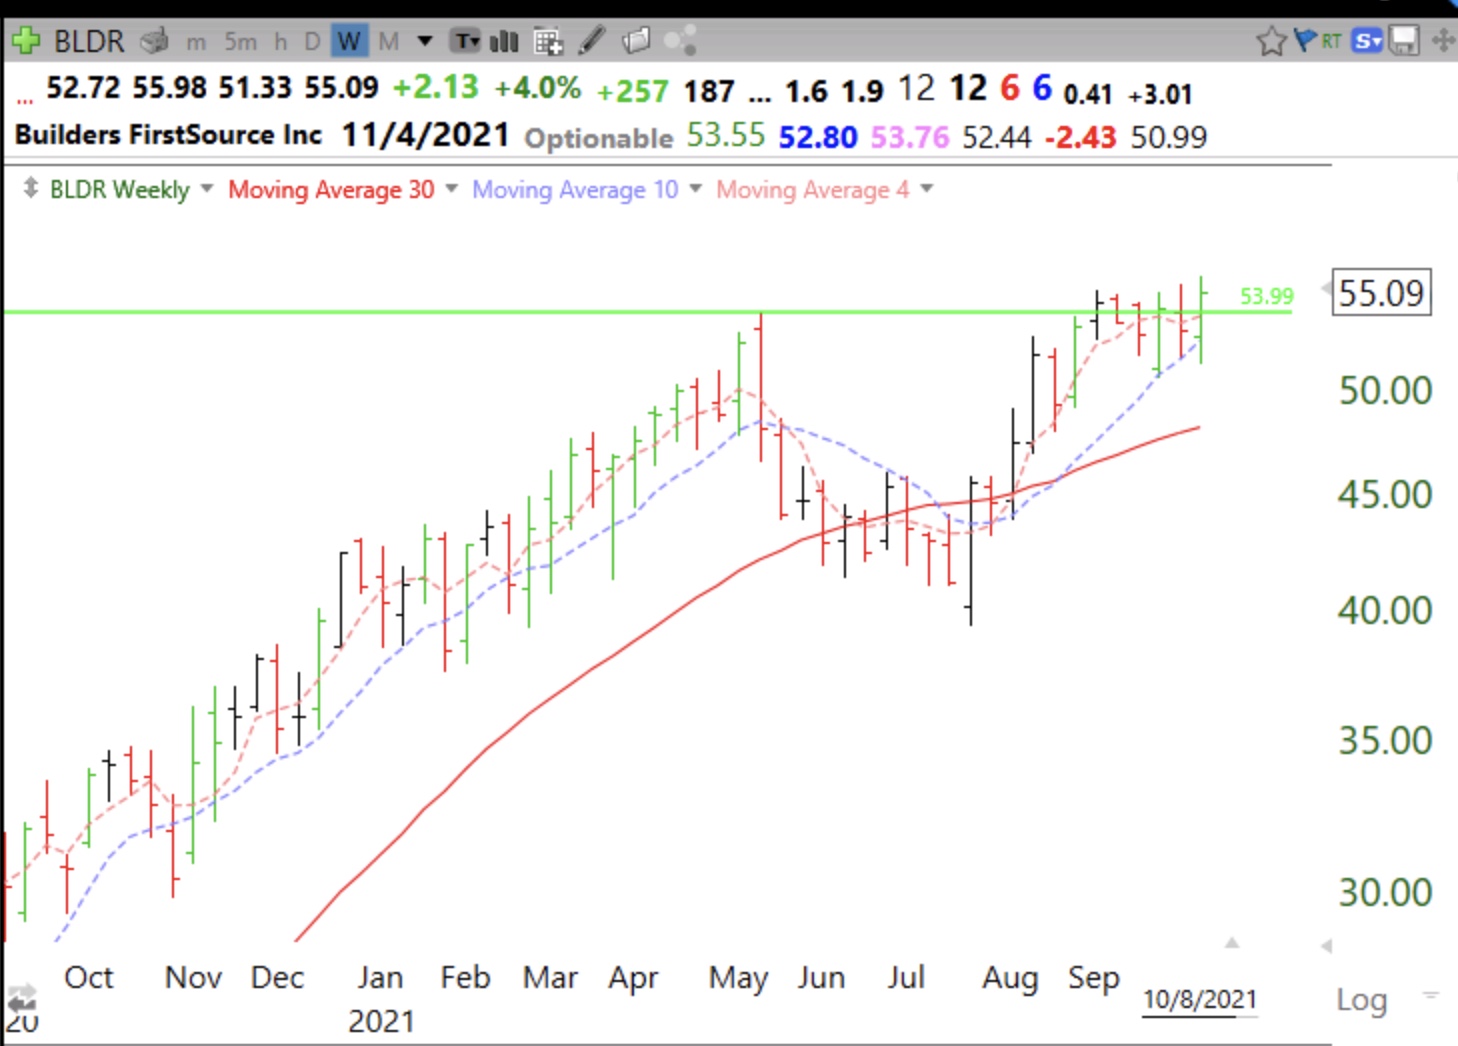
Weekly charts show stock patterns most clearly. WAL has had a nice cup and small handle break-out.
As BLDR.
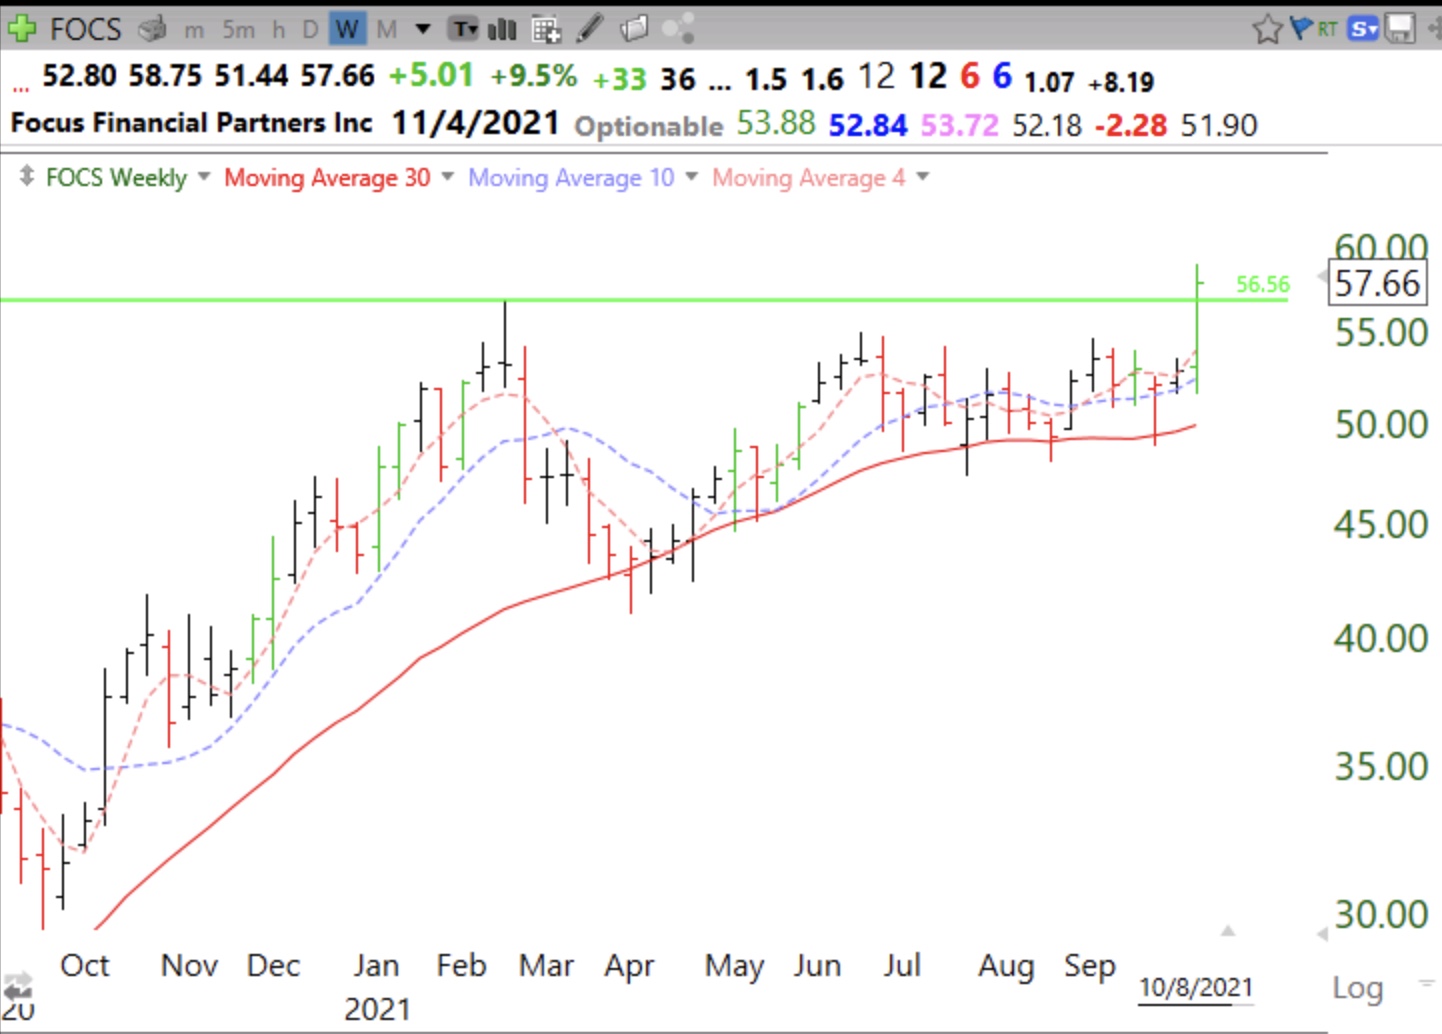
And FOCS
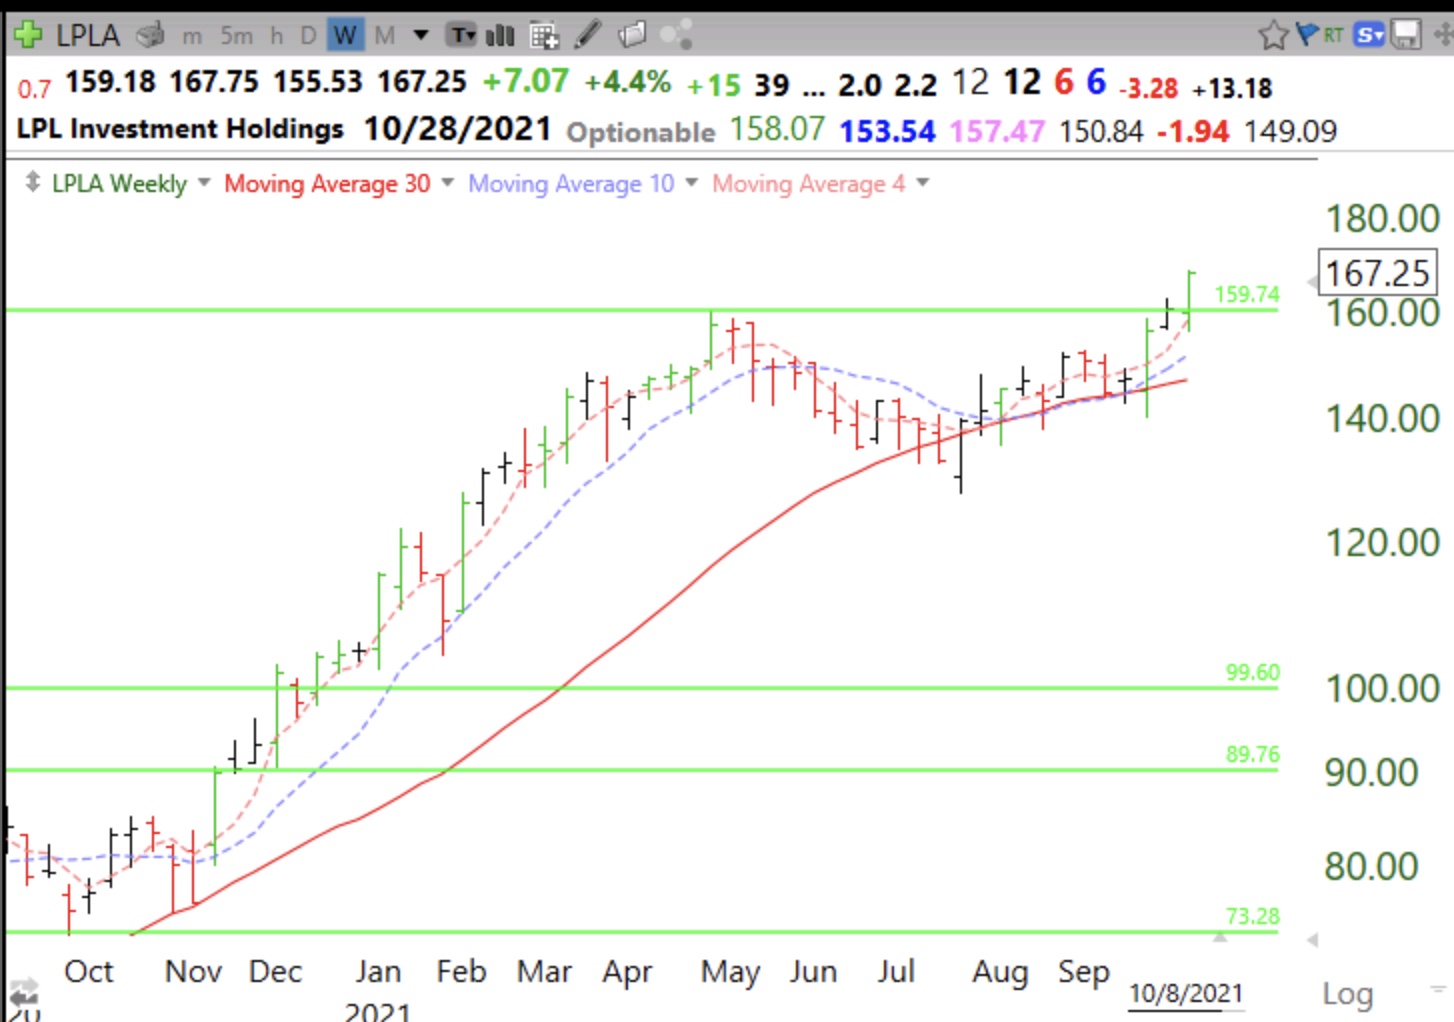
And LPLA
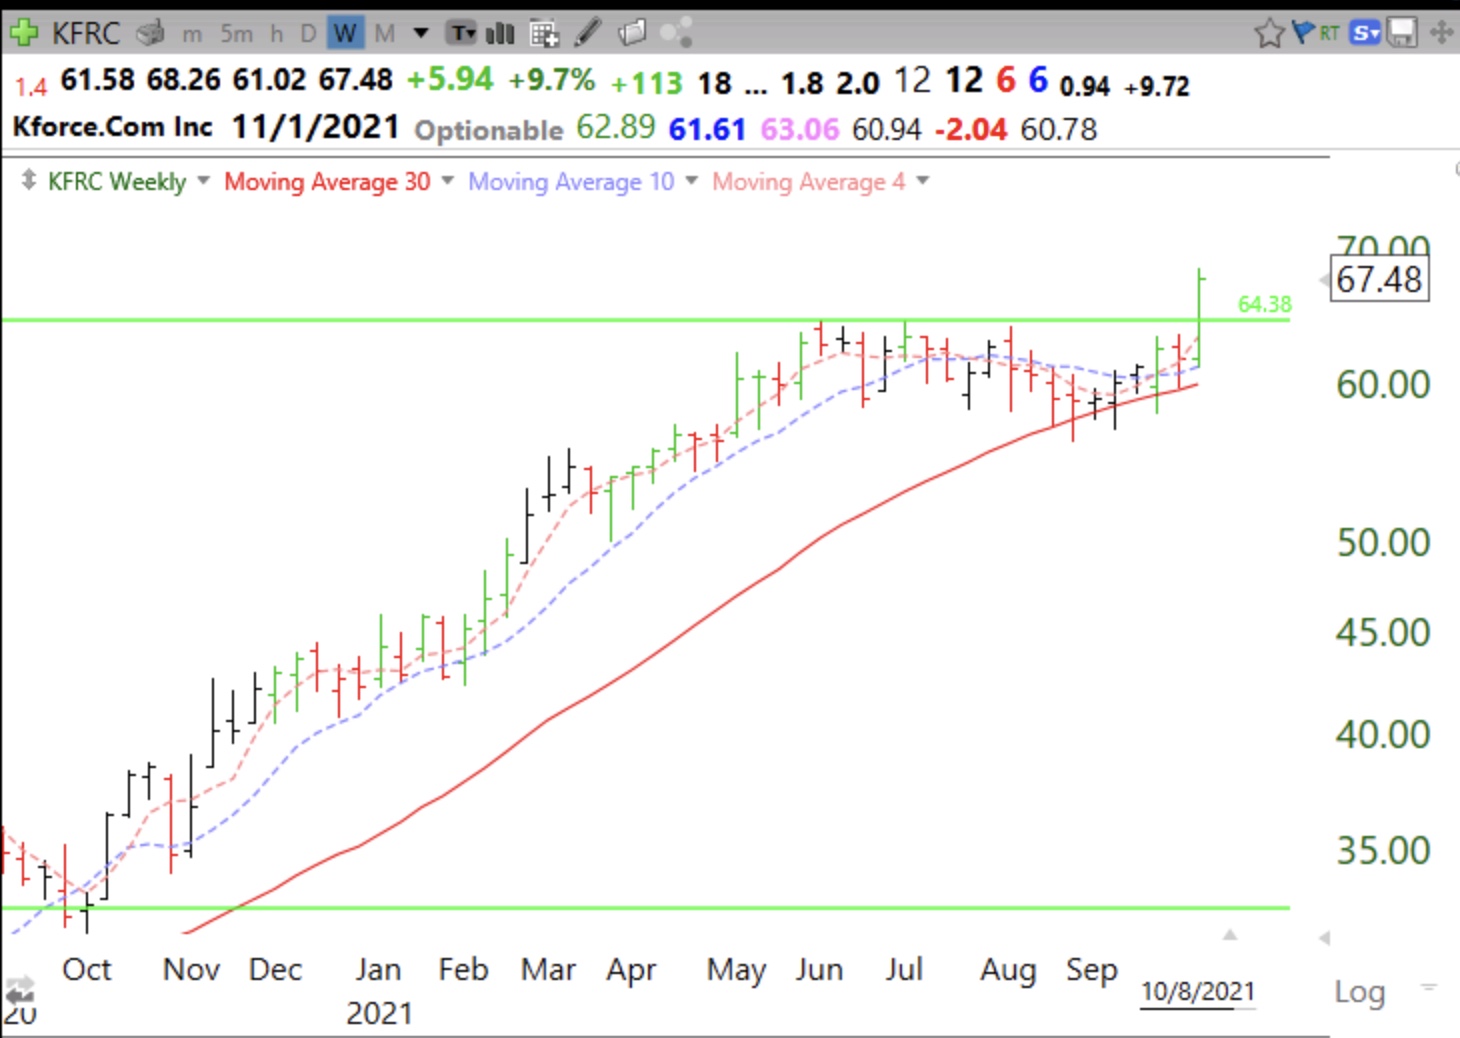
And KFRC
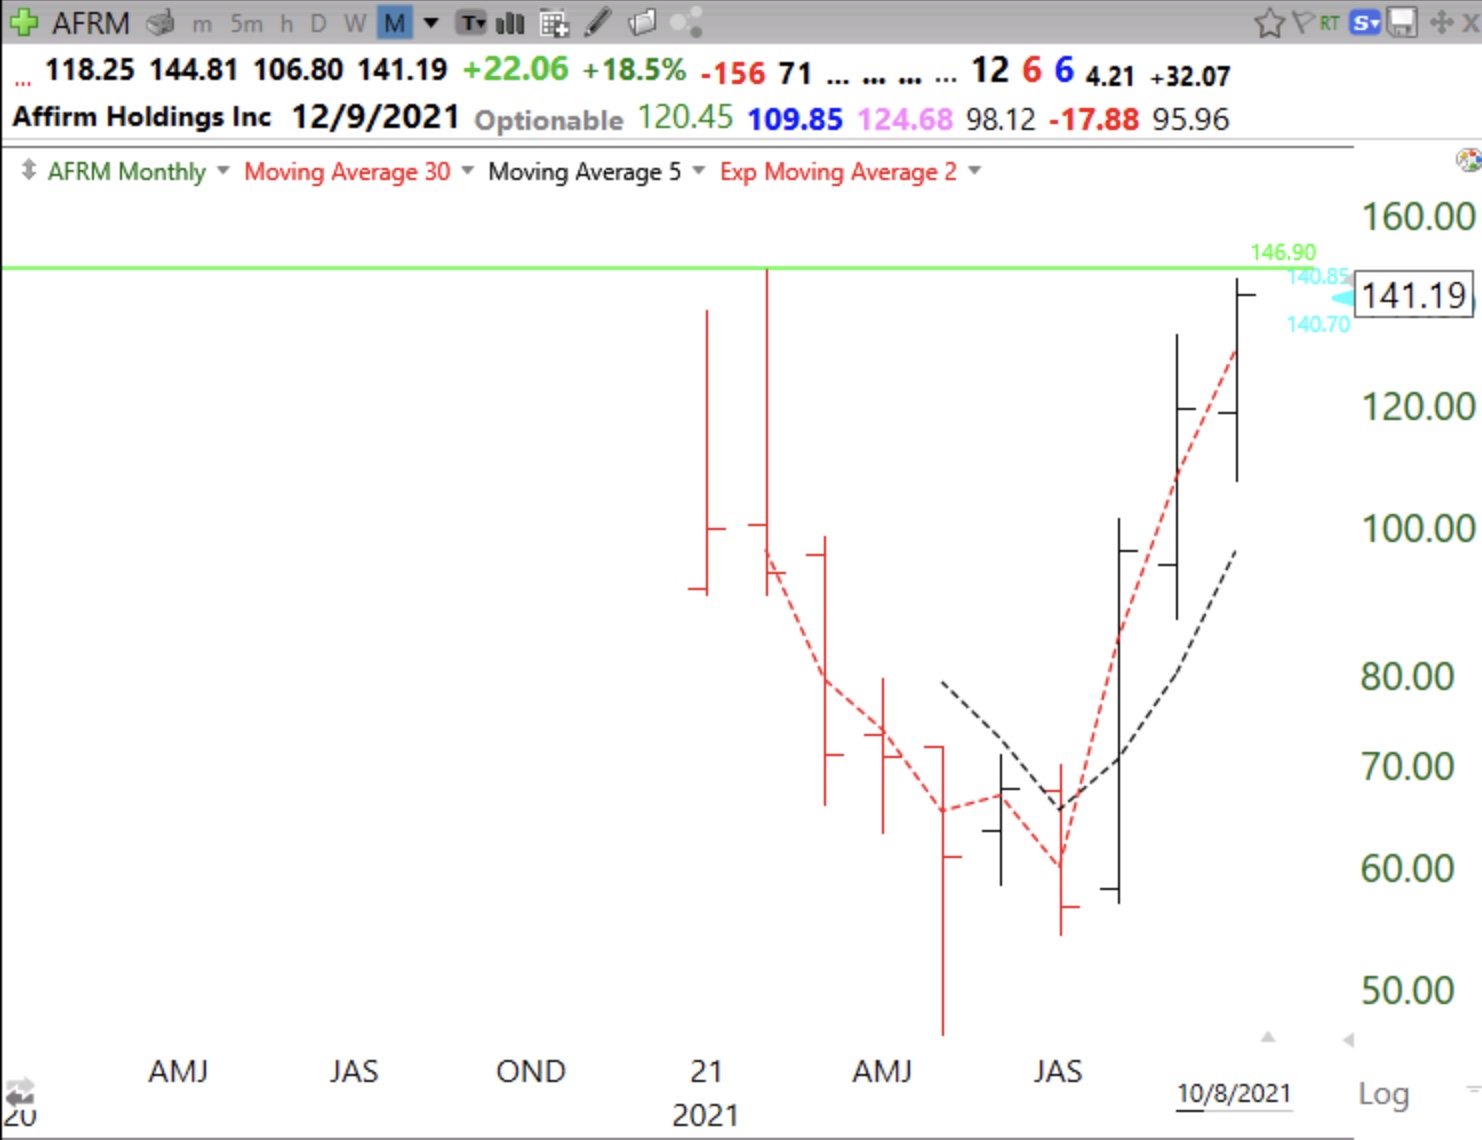
I am also watching UPST for a possible GLB. See monthly chart.
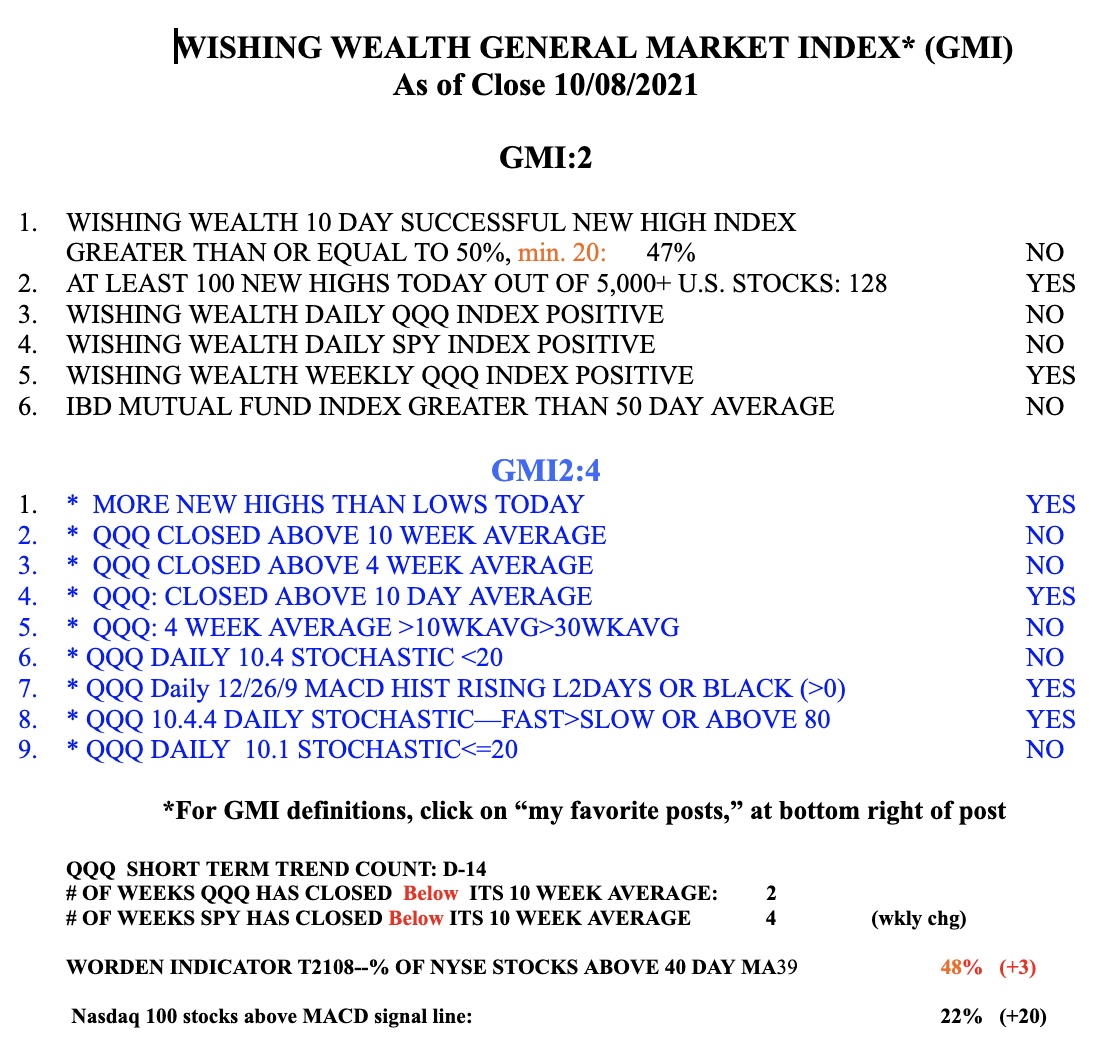
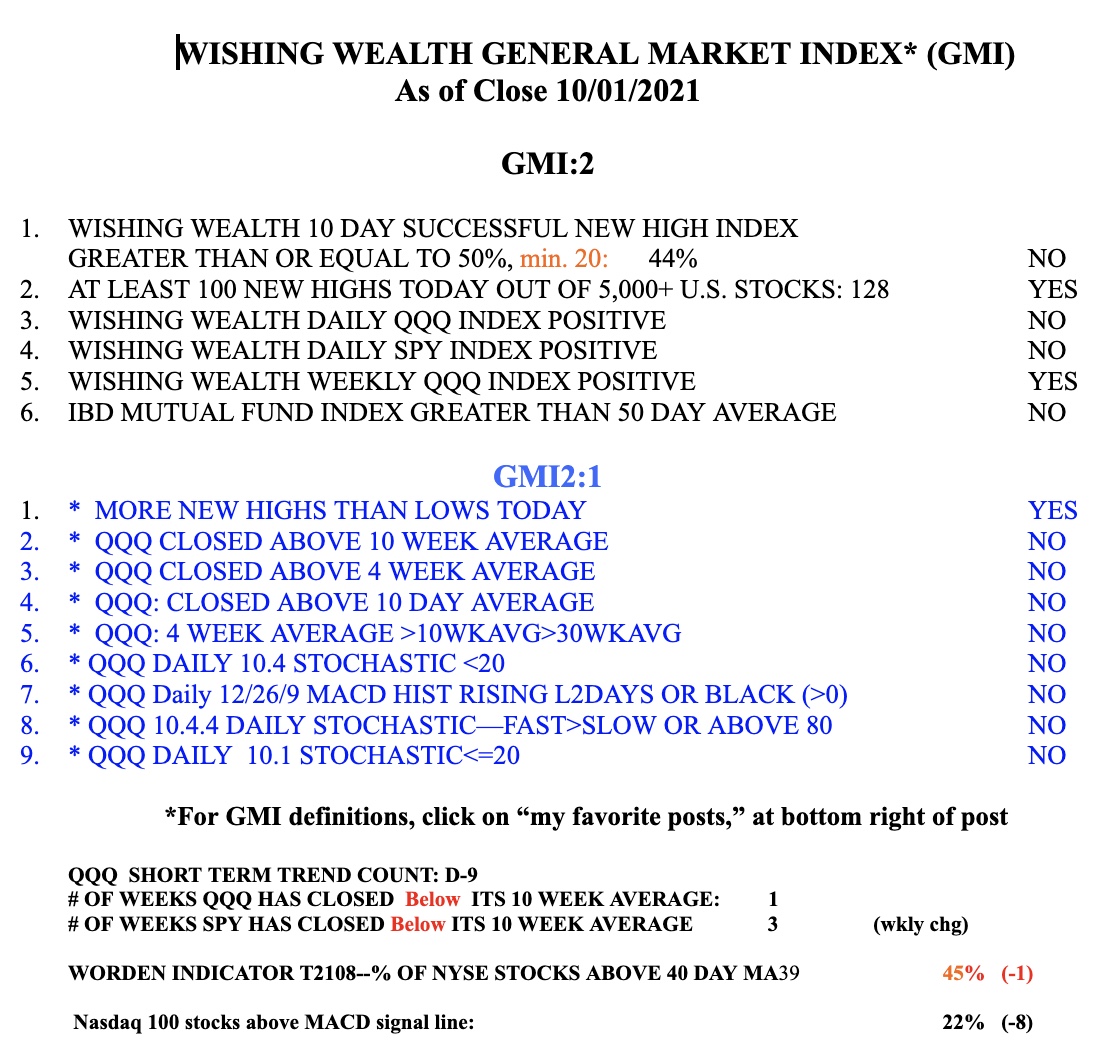
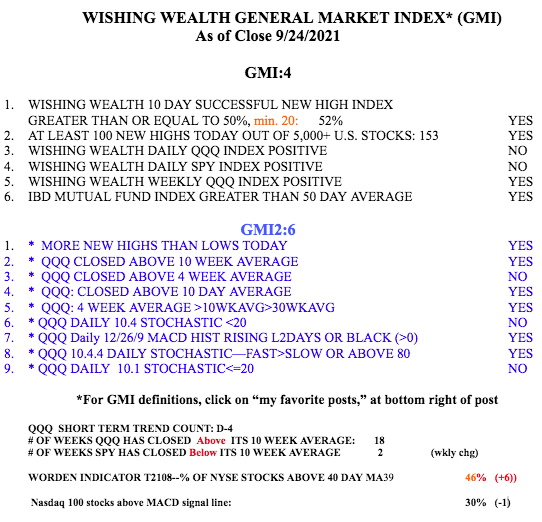
The GMI remains on a Red signal but in the past has been slow in catching bottoms. Only 40% of newsletter writers are bullish, down from over 60%. Remember, bottoms often occur in October and 3rd quarter earnings are about to come out. Watch how the market reacts to earnings as an indication of its health.