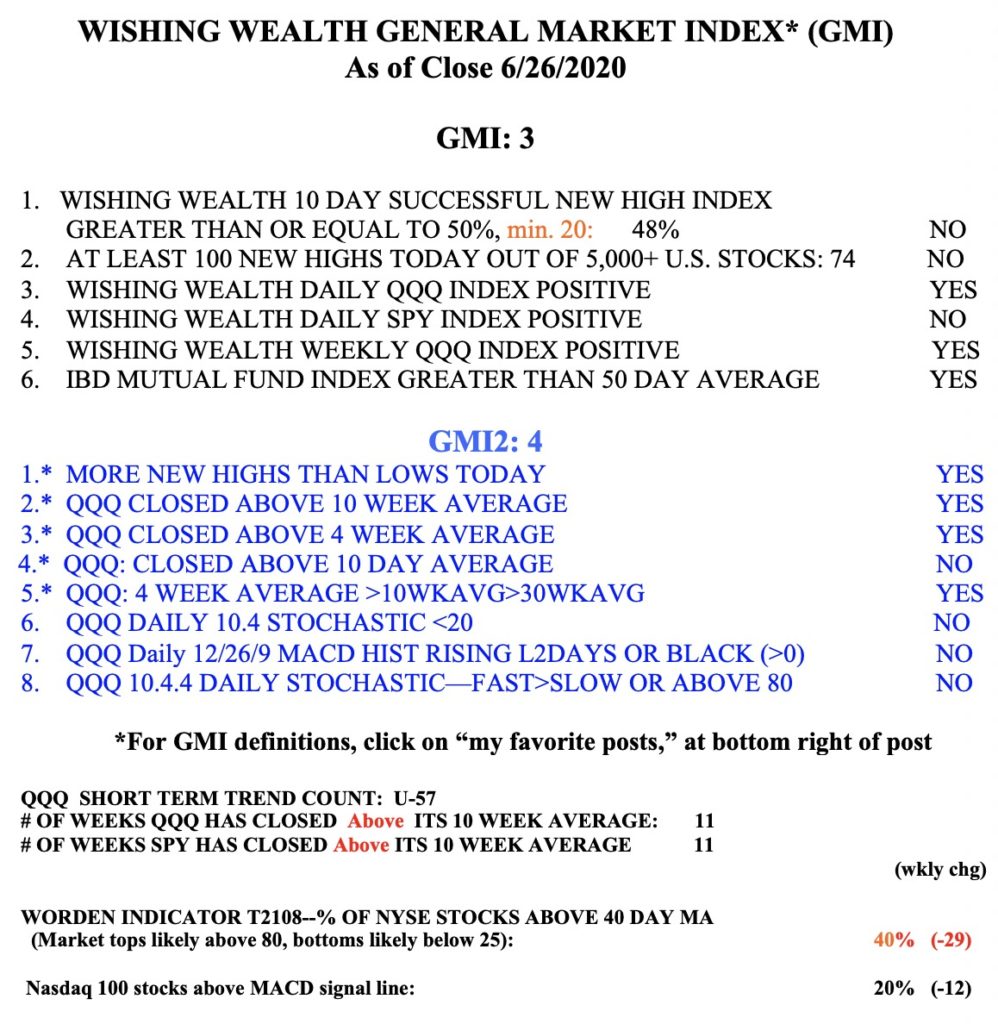
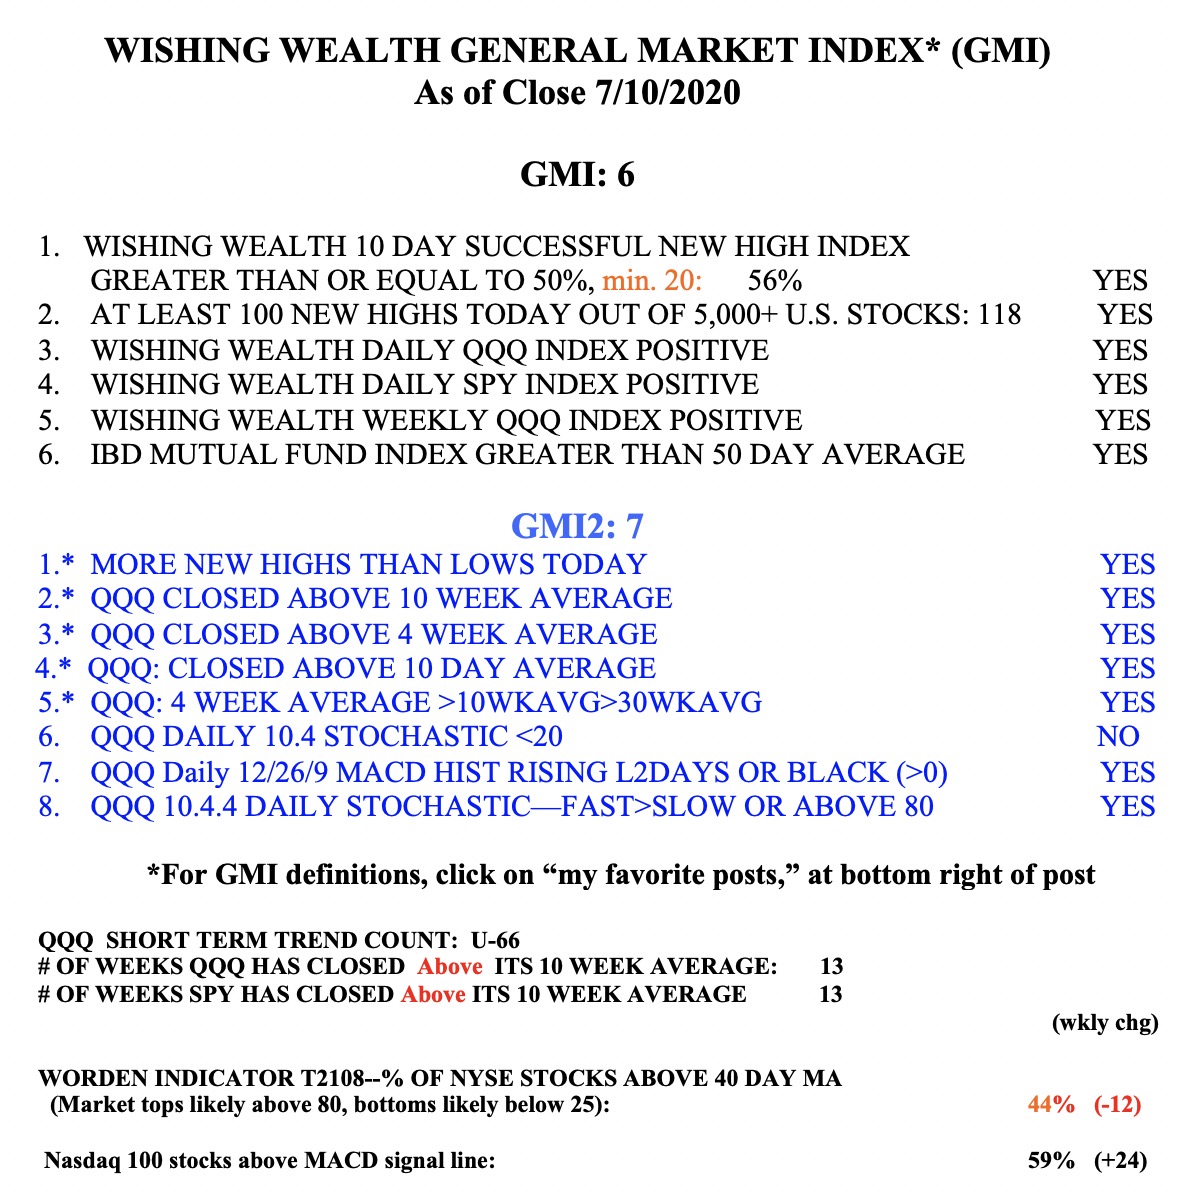
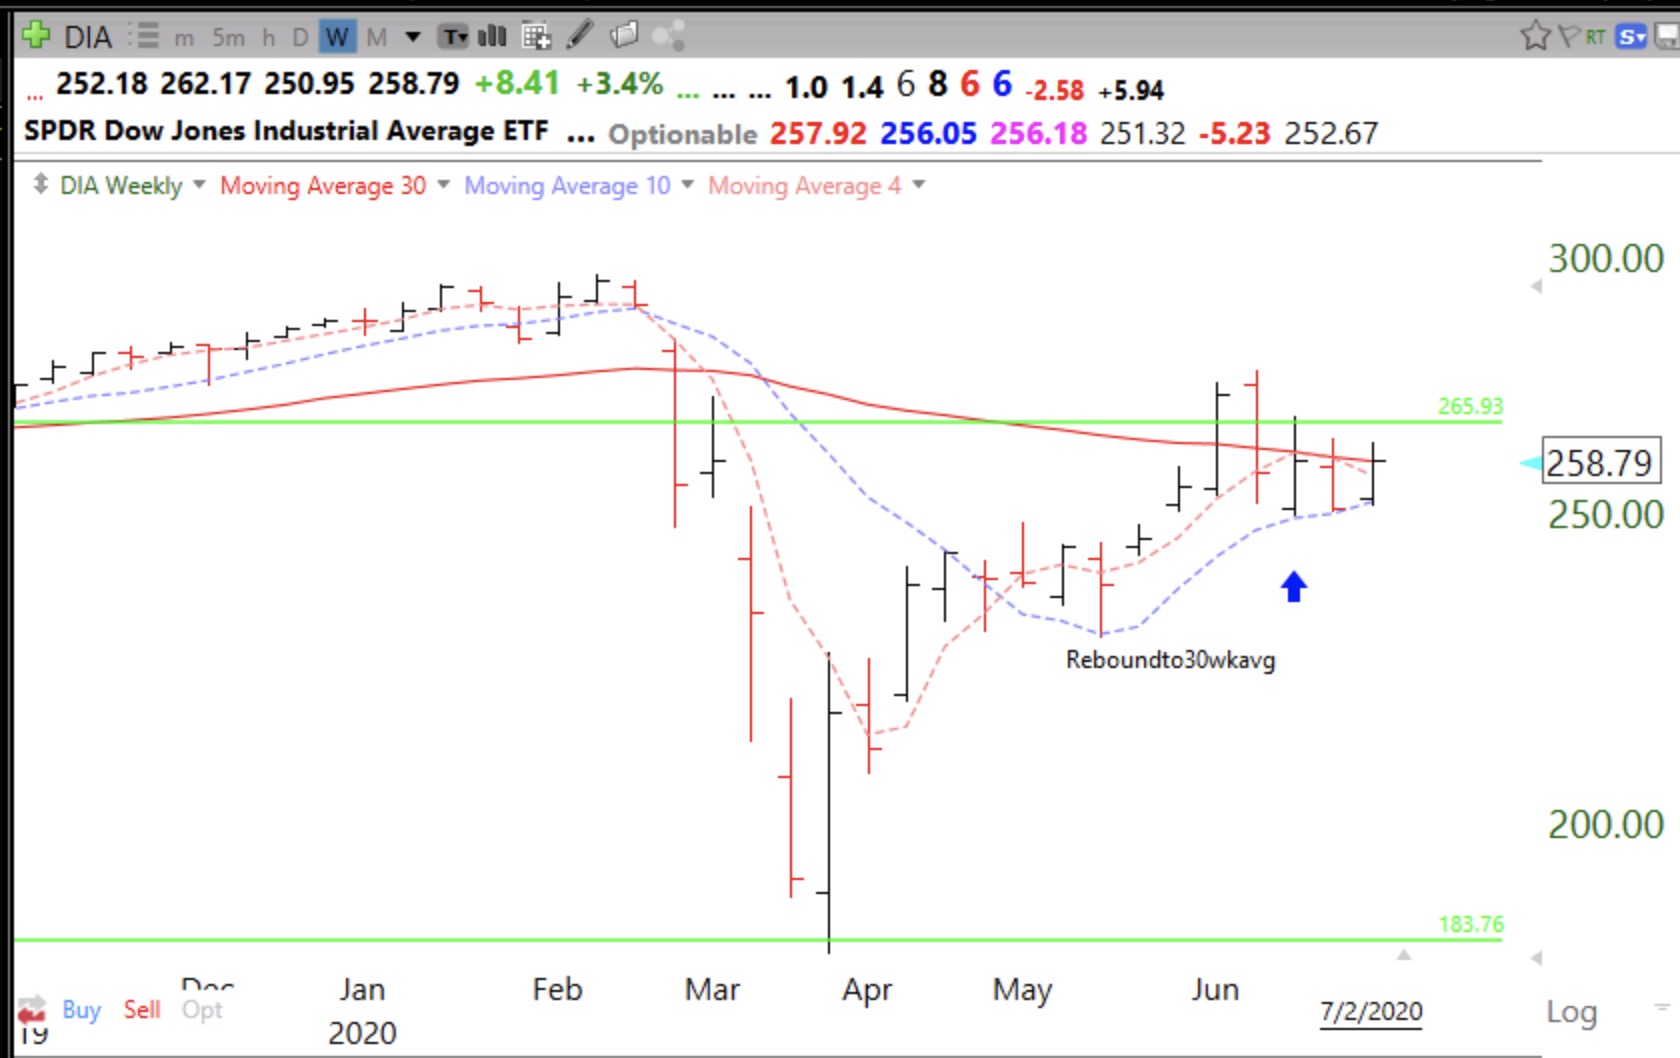
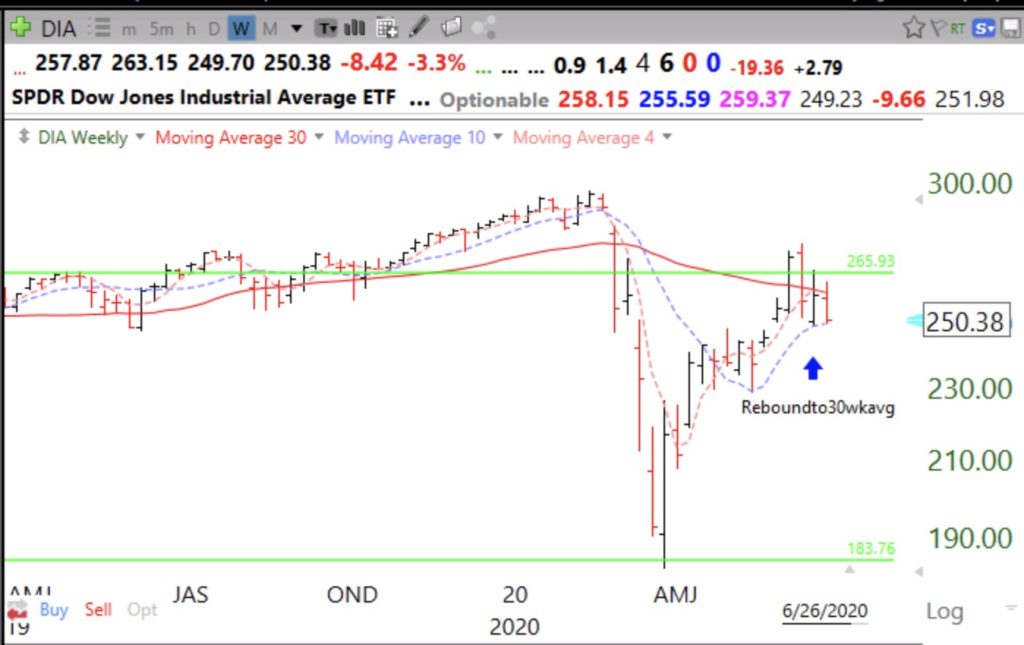
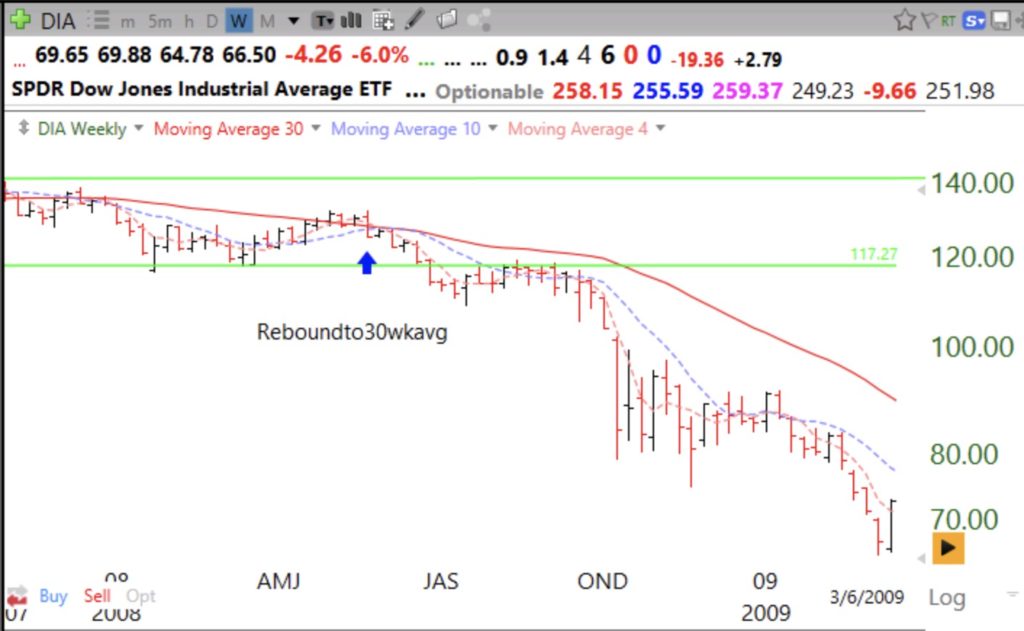
I successfully avoided the 2000 and 2008 market debacles by getting out when the major indexes closed below their declining 30 week averages. Such a pattern could indicate the beginning of a Weinstein Stage IV decline. The DIA and SPY have now closed below their declining 30 week averages.
Here is DIA in 2007-8 top.
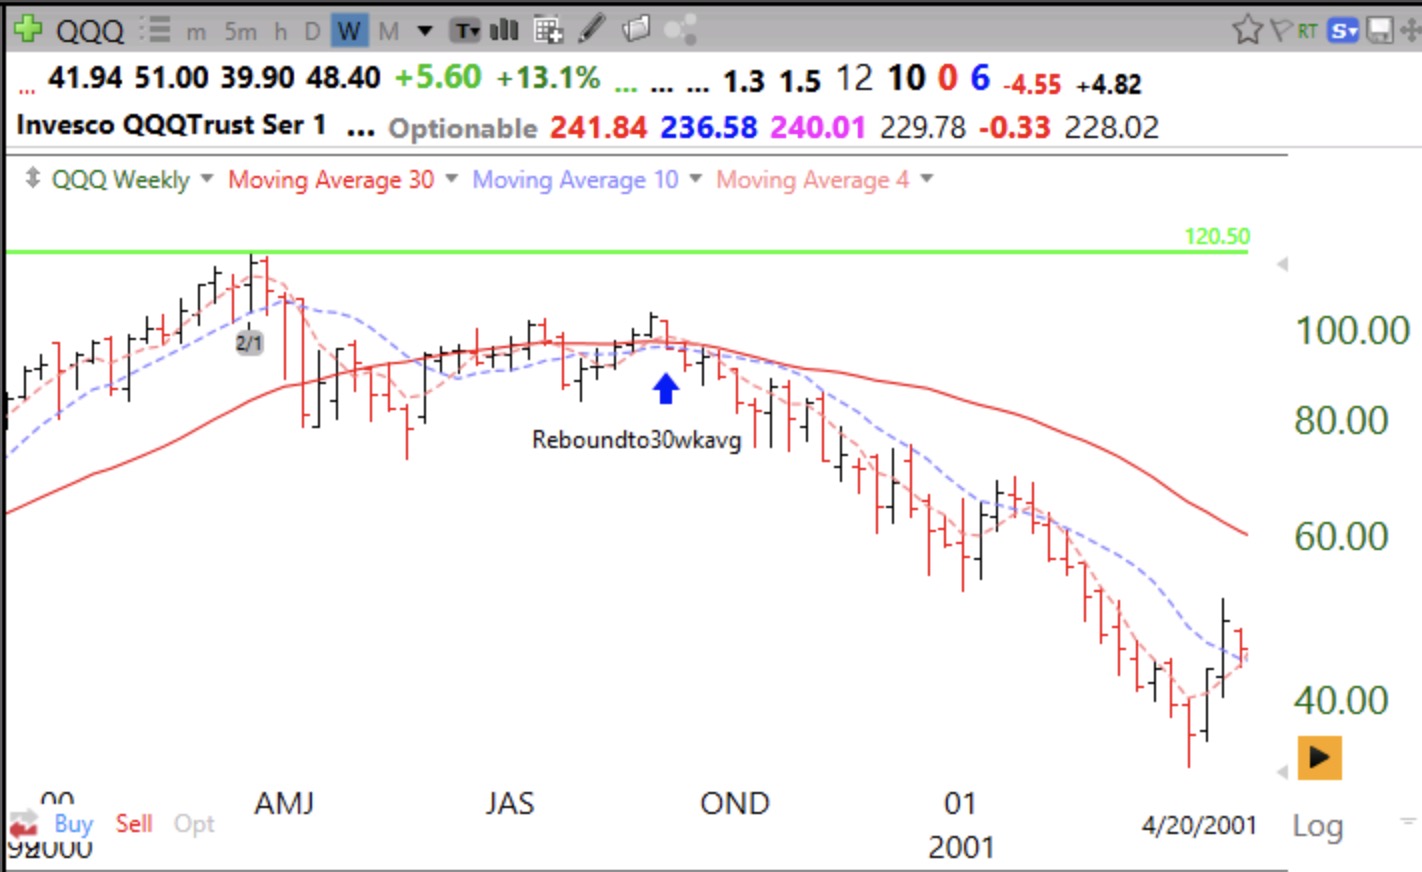
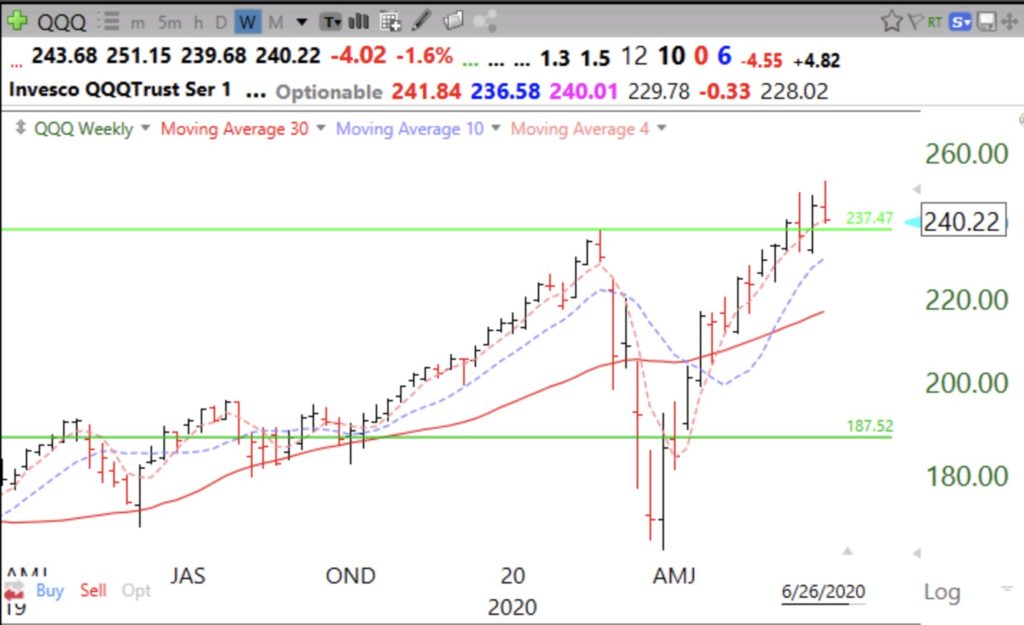
And QQQ in 2000.

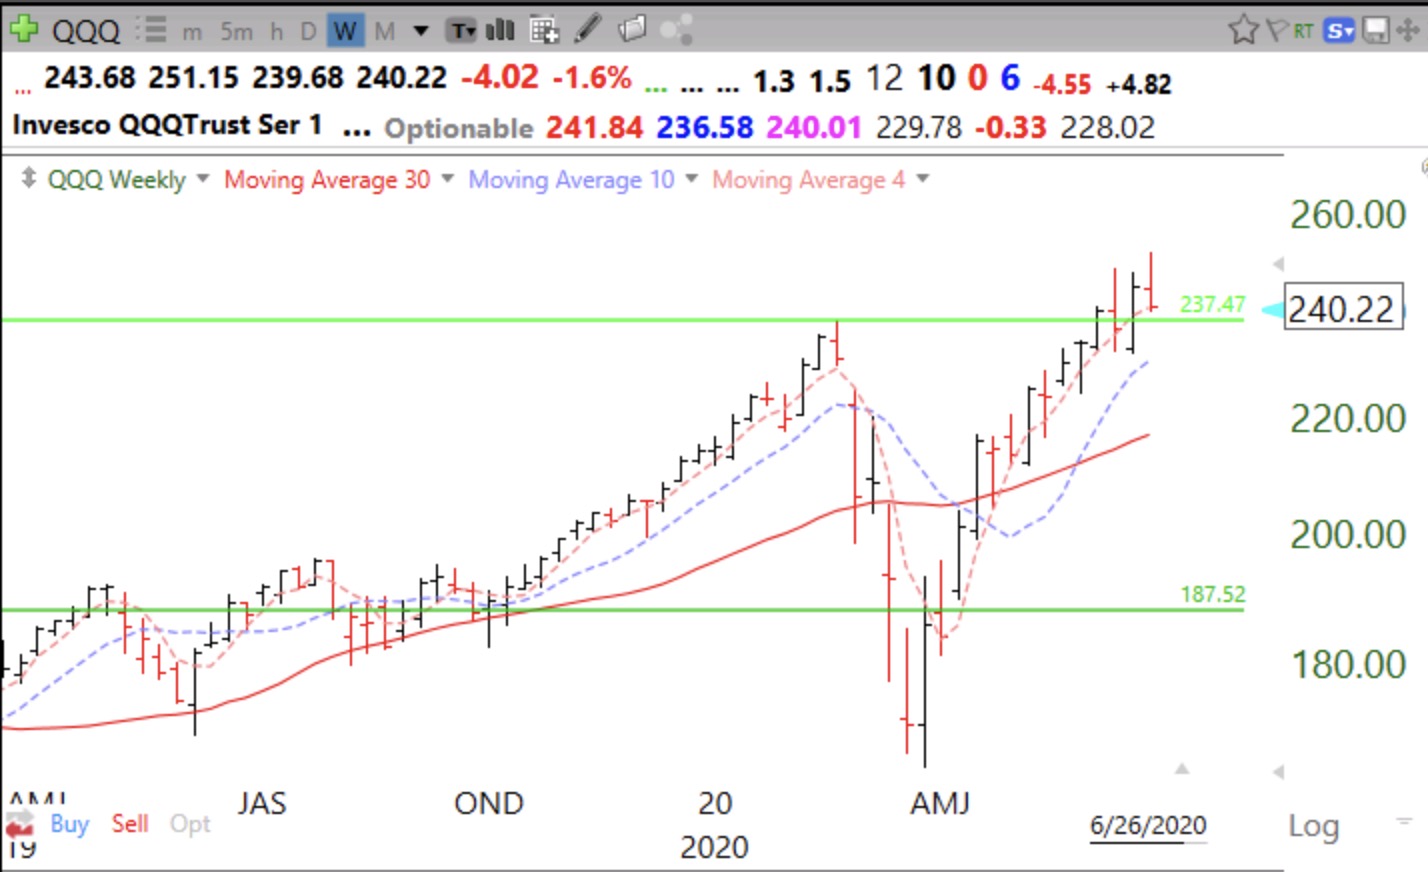
The QQQ is the strongest of the 3 index ETFs and is still above its rising 30 week average. If it closes back below its green line, it would be a sign of a failed GLB and major technical weakness.
I am too near retirement and therefore a chicken. So I pulled all of my money out of the market on Friday. It is nice to be on the sidelines. When my indicators look good again, I will re-enter the market. I am short in my trading account with a small position in the 3x inverse ETF, SDOW, and GLD. Be careful. The worst of the decline may be yet to come.