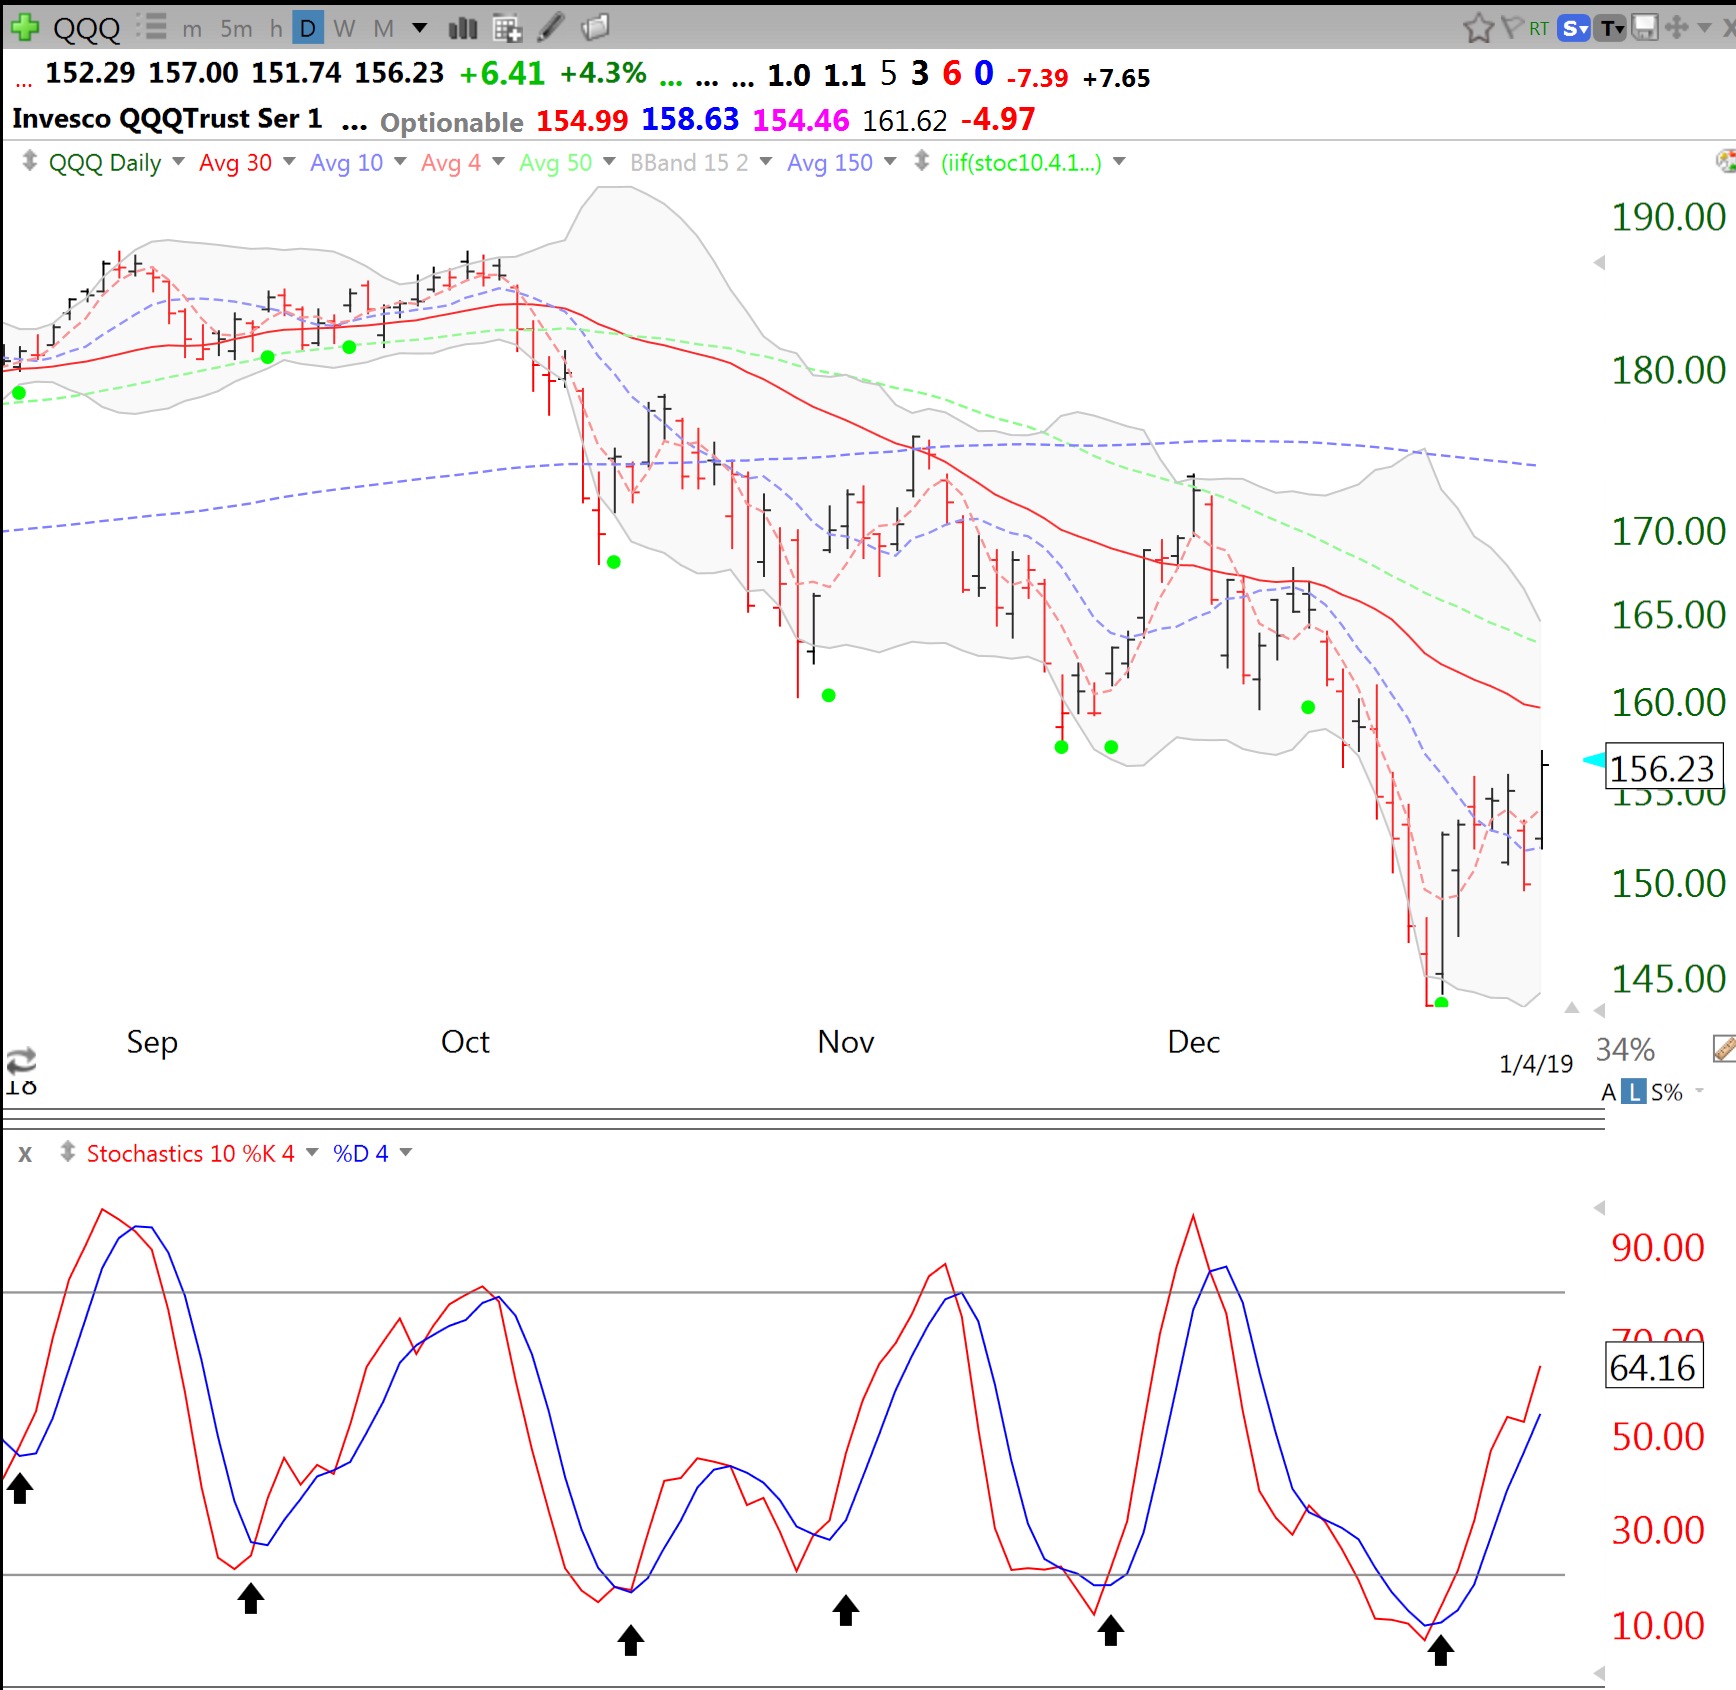
You can learn about the green dot indicator in my prior posts. It is a daily 10.4 stochastic cross and indicated by a green dot on the price chart and the arrow on the stochastic chart below. When a stock or index ETF is in a sustained up-trend (QQQ is not) buying on the green dot signal often works for me. During a down-trend one can sometimes also get a tradable bounce. You can access at my TC2000 Club a video showing how to add the green dots to the price chart.
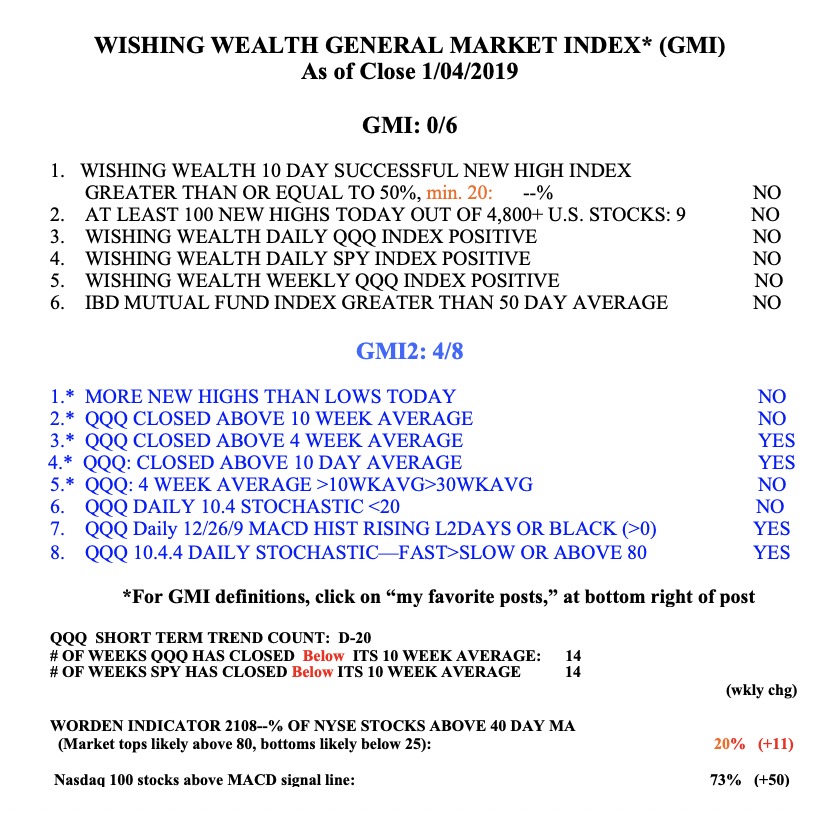
The GMI remains at 0 (of 6) and on a Red signal.