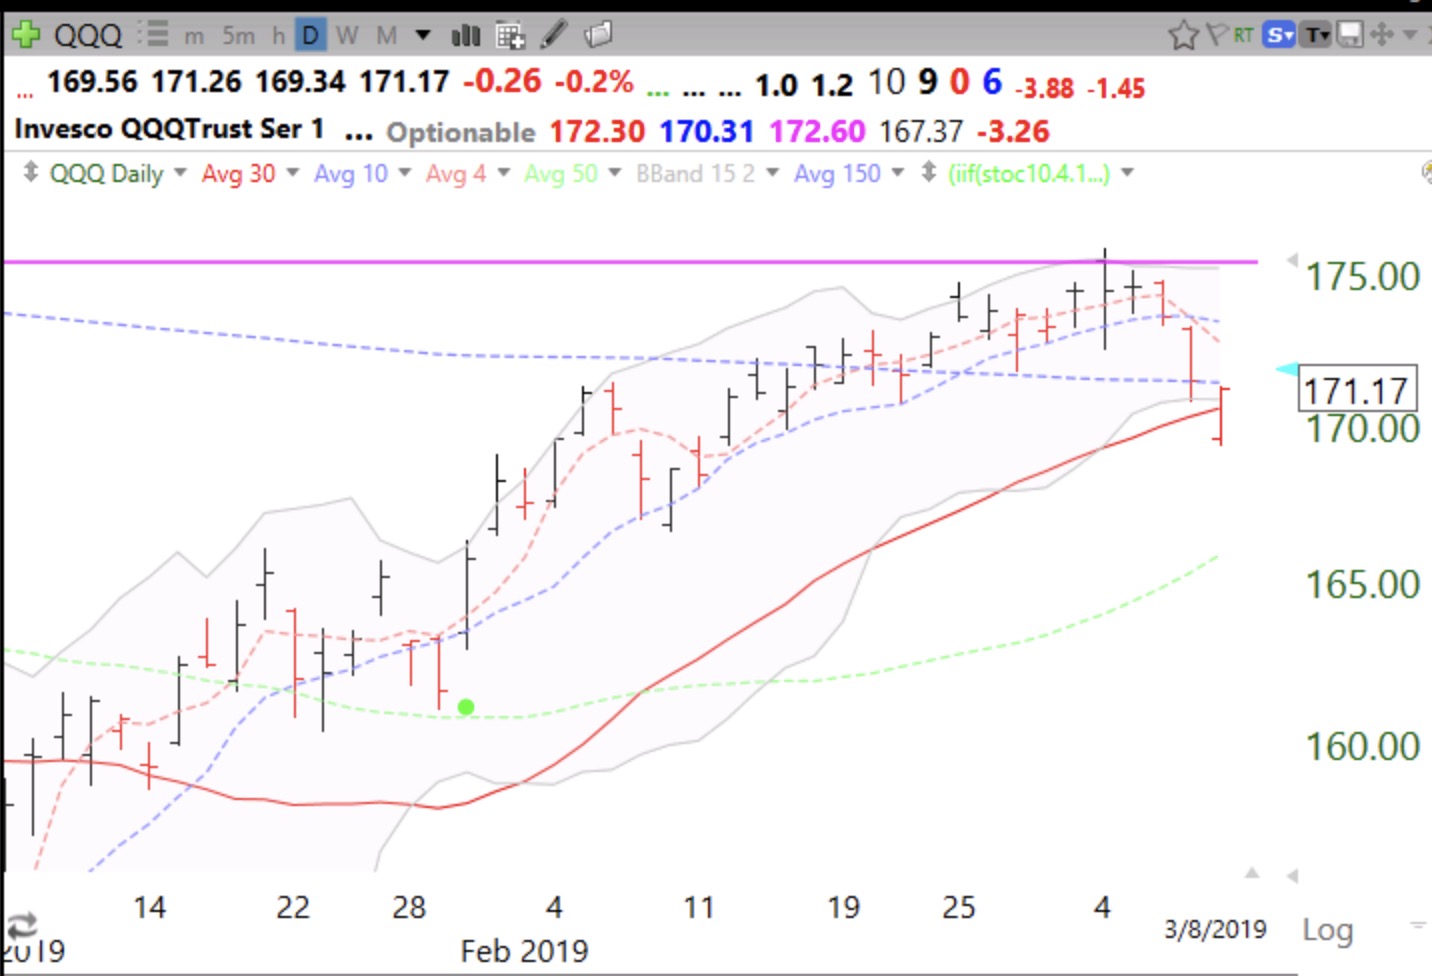
The last time so many stocks touched their bottom daily 15.2 Bollinger Band was last December, just before the recent rally. The QQQ index ETF also did so on Friday. Friday’s low must not be violated.
Stock Market Technical Indicators & Analysis
The last time so many stocks touched their bottom daily 15.2 Bollinger Band was last December, just before the recent rally. The QQQ index ETF also did so on Friday. Friday’s low must not be violated.
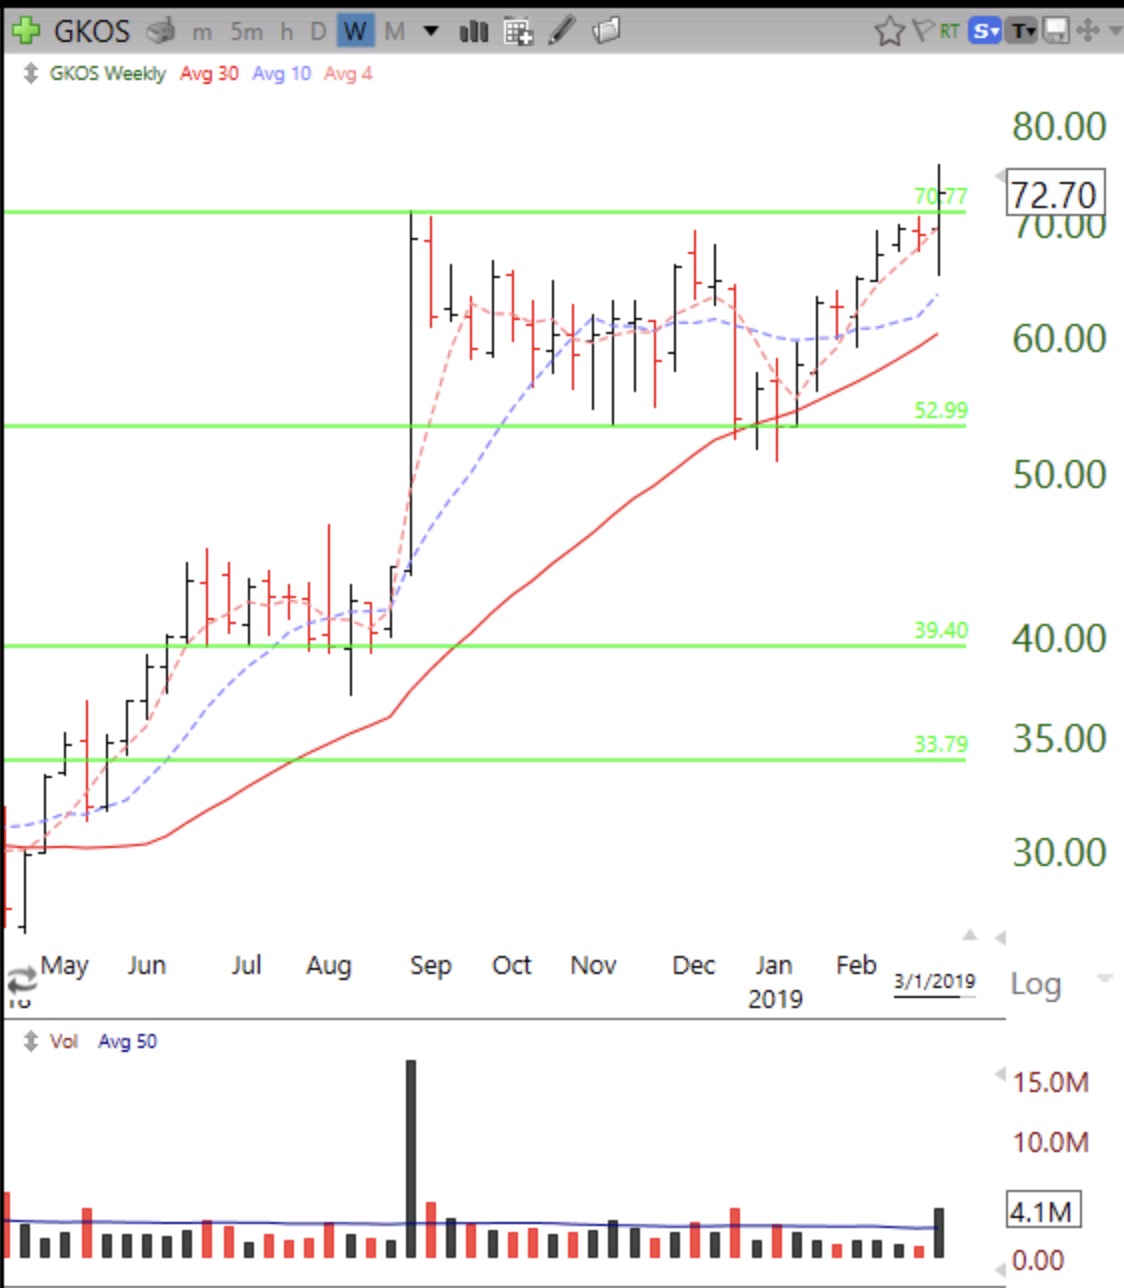
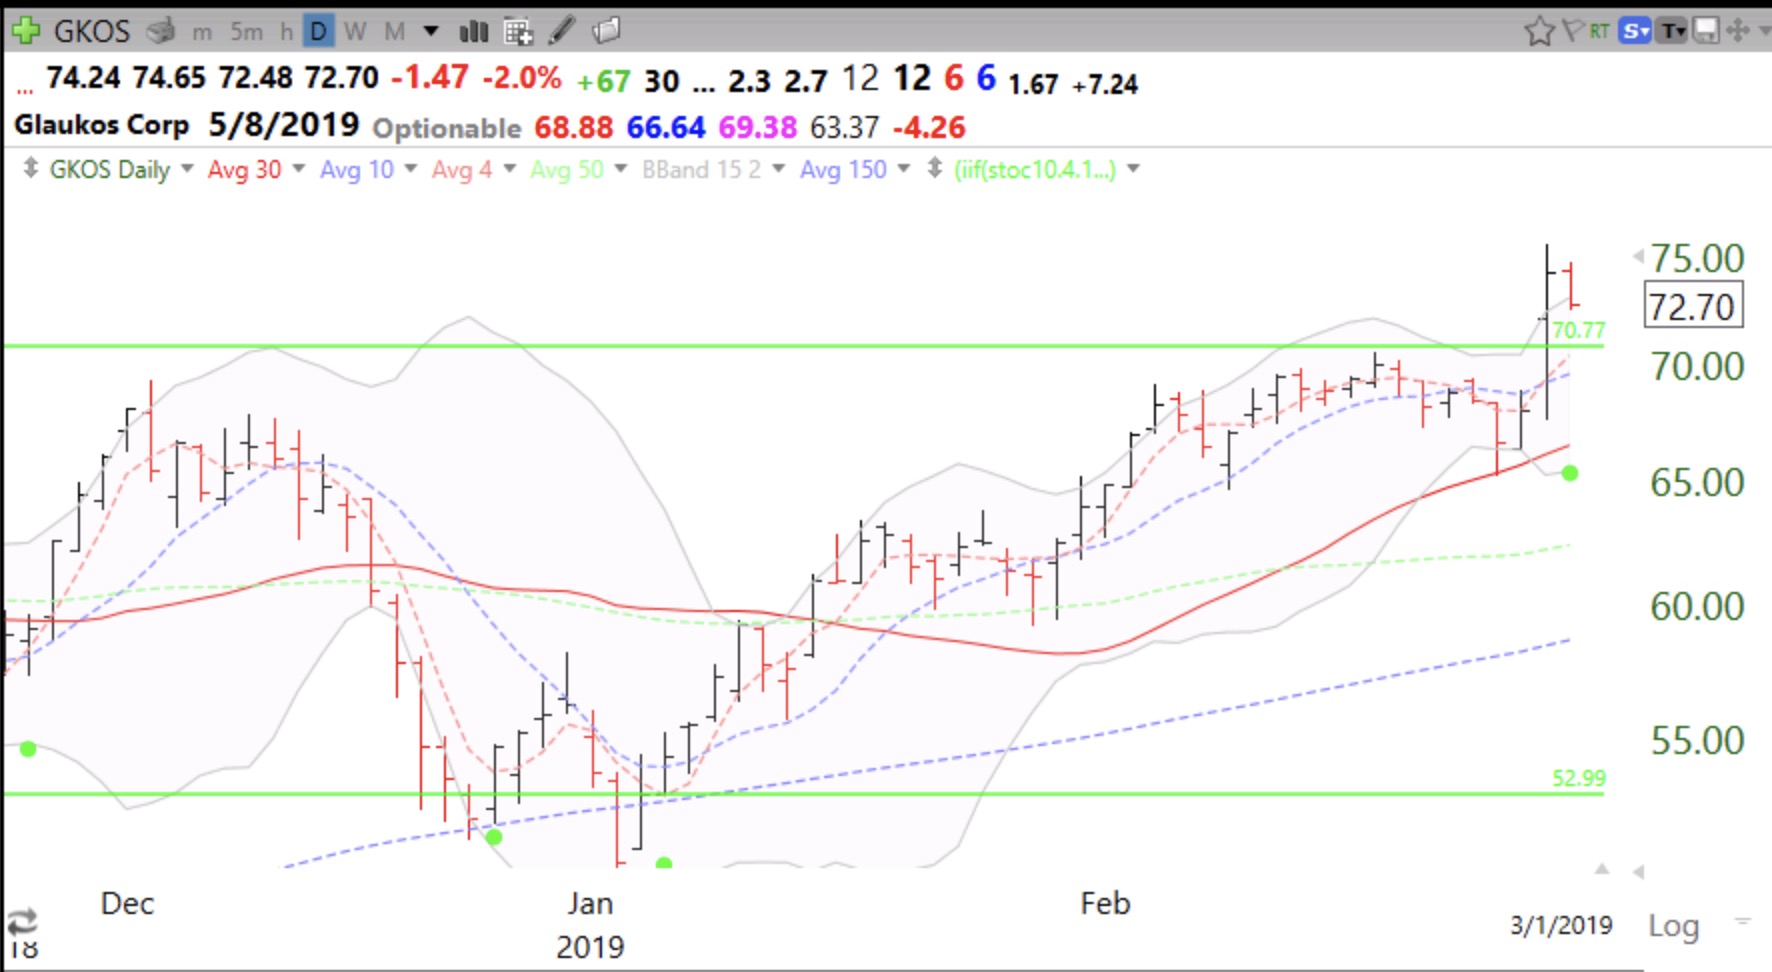
I like to find recent GLB stocks that have a green dot signal. I am focusing on very strong stocks near their ATH and in an up trend that have an indication of a short term bounce (green dot). The weekly chart below shows the nice long term set-up of GKOS. It is clearly in a Stage II up-trend and has been consolidating after a huge week last August. The daily chart shows the green dot set-up. In addition, the stock has recently bounced up from its lower 15.2 daily Bollinger Band. GKOS is starting to report profitable quarters. If I bought GKOS my sell stop would be below the low of the recent bounce. I also might sell sooner if it closed back below its green line. You can find a video for adding green dots to your TC2000 charts at my TC2000 club.
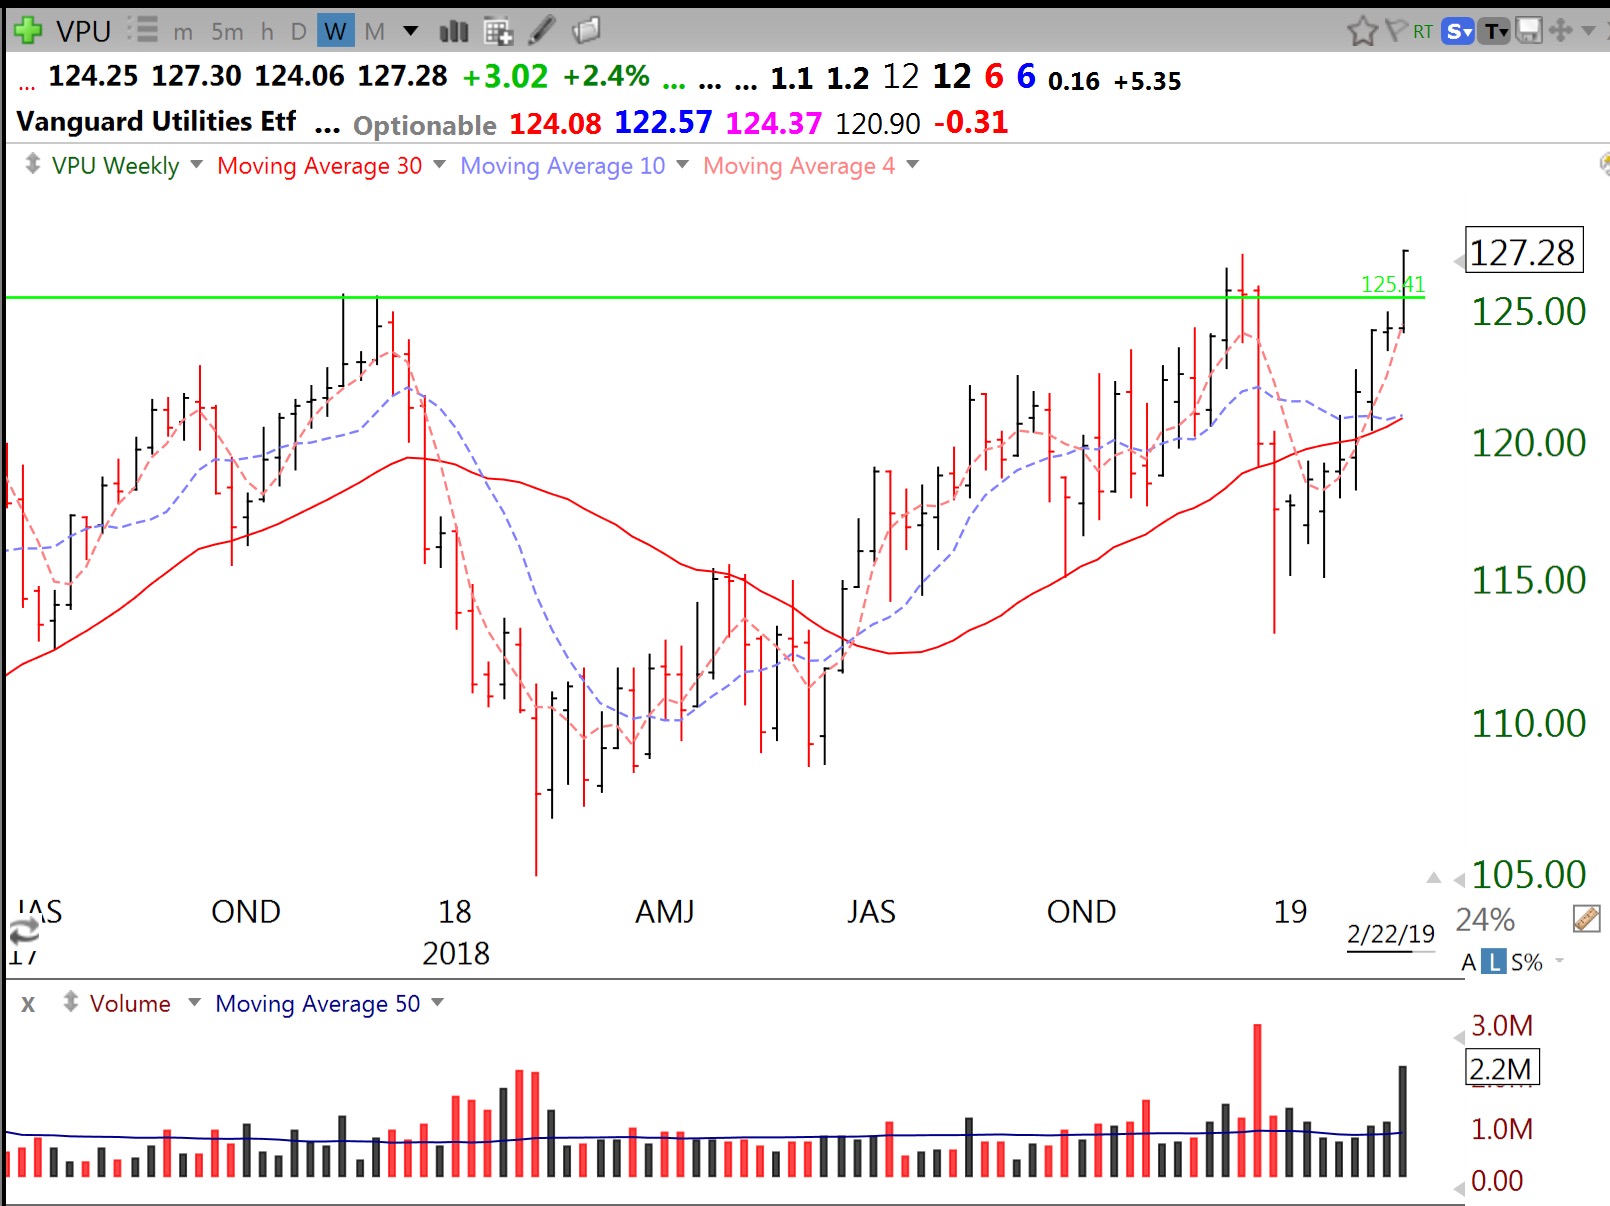
Dividend paying utilities are also back in favor. Weekly chart of ETF VPU shows GLB on above average volume.