I inherited a wonderful dog from my late sister a year ago. I had owned a dog in the 70s while in graduate school but did not realize how attached I would become to my new pet. I love”Brady”, named after you know who in Boston where my sister lived. Anyway, I have now learned how expensive dogs are these days, with huge potential vet bills and even health insurance. I have been feeding Brady the kibble that my sister instructed me to, but both Brady and I became bored with his daily diet of dry pebbles. Then one day while in the supermarket I noticed a refrigerator filled with fresh, never frozen, human grade food for dogs (also cats). I bought some and Brady came alive when I filled his bowl. He smacked his lips and followed me to his food bowl–a new behavior that persists. While not cheap, I know that pet owners spend lots of money to keep their pets, and themselves, happy. Given this experience, I had to see if this dog food came from a publicly traded company–and it did–Freshpet- FRPT.
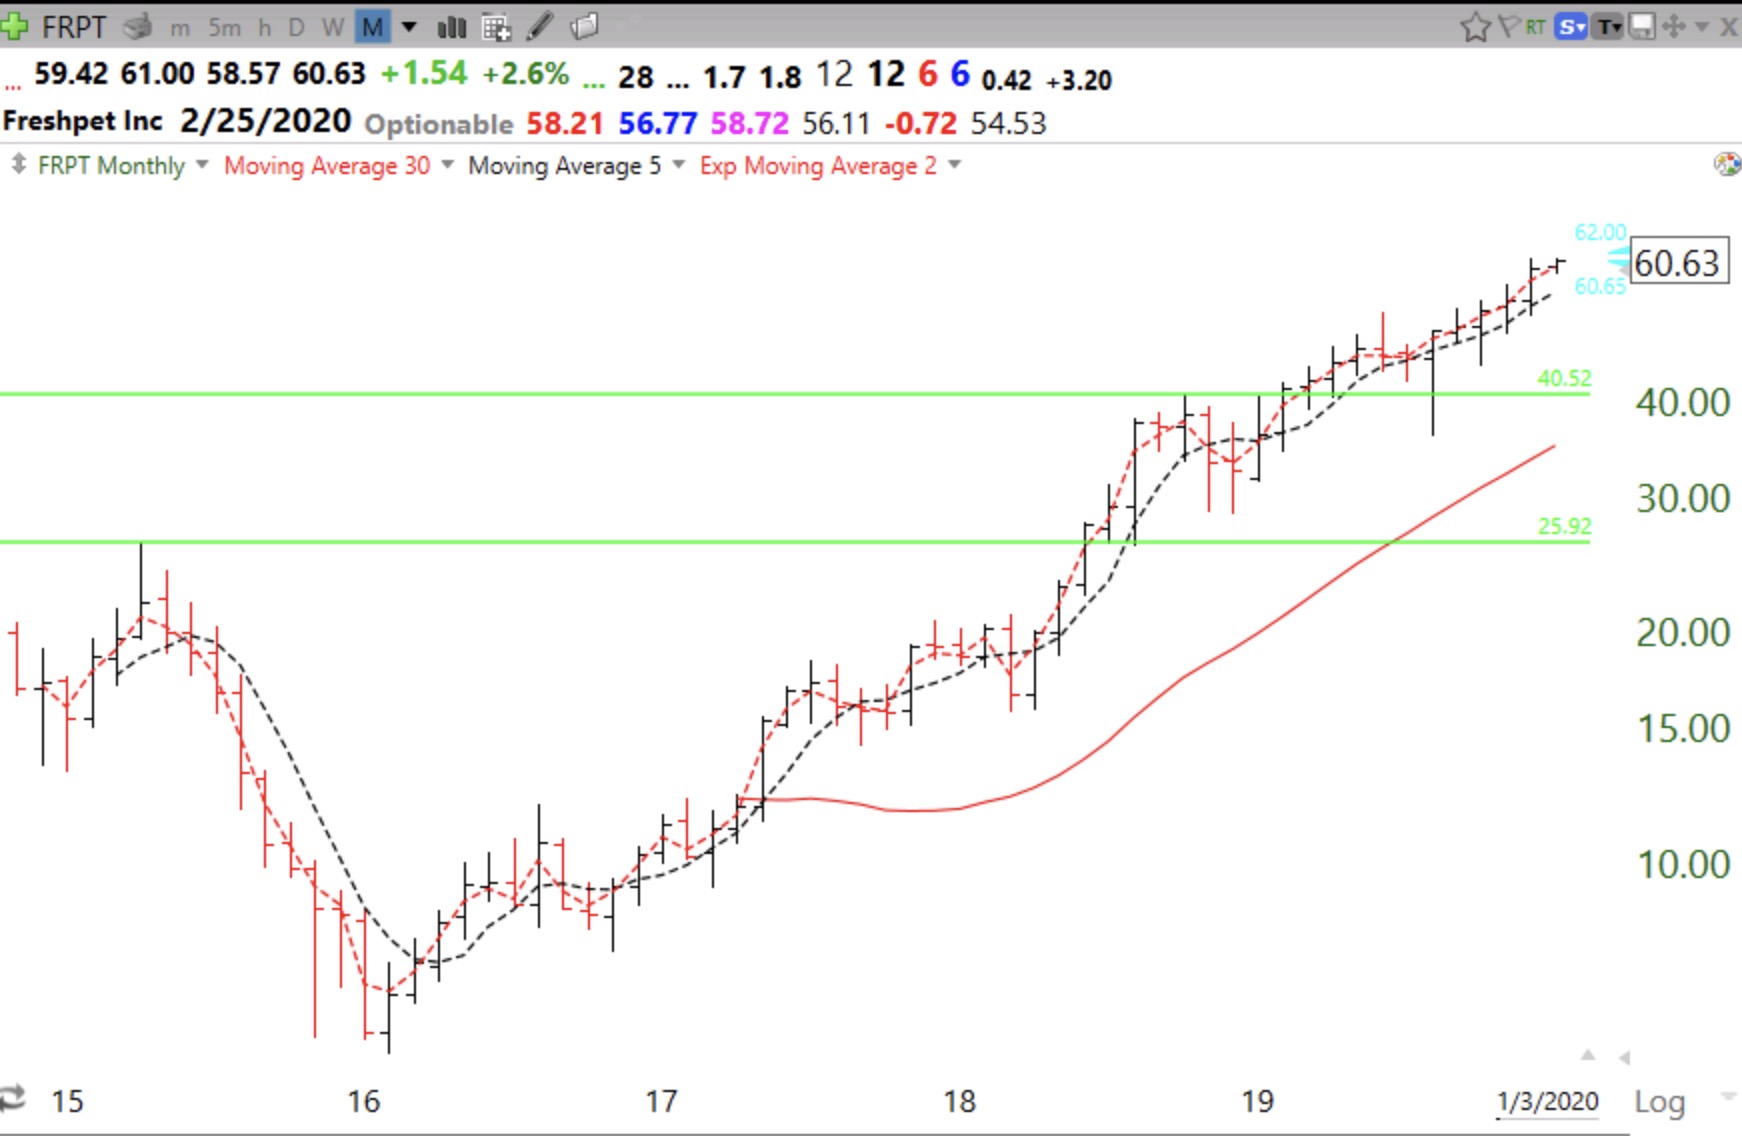
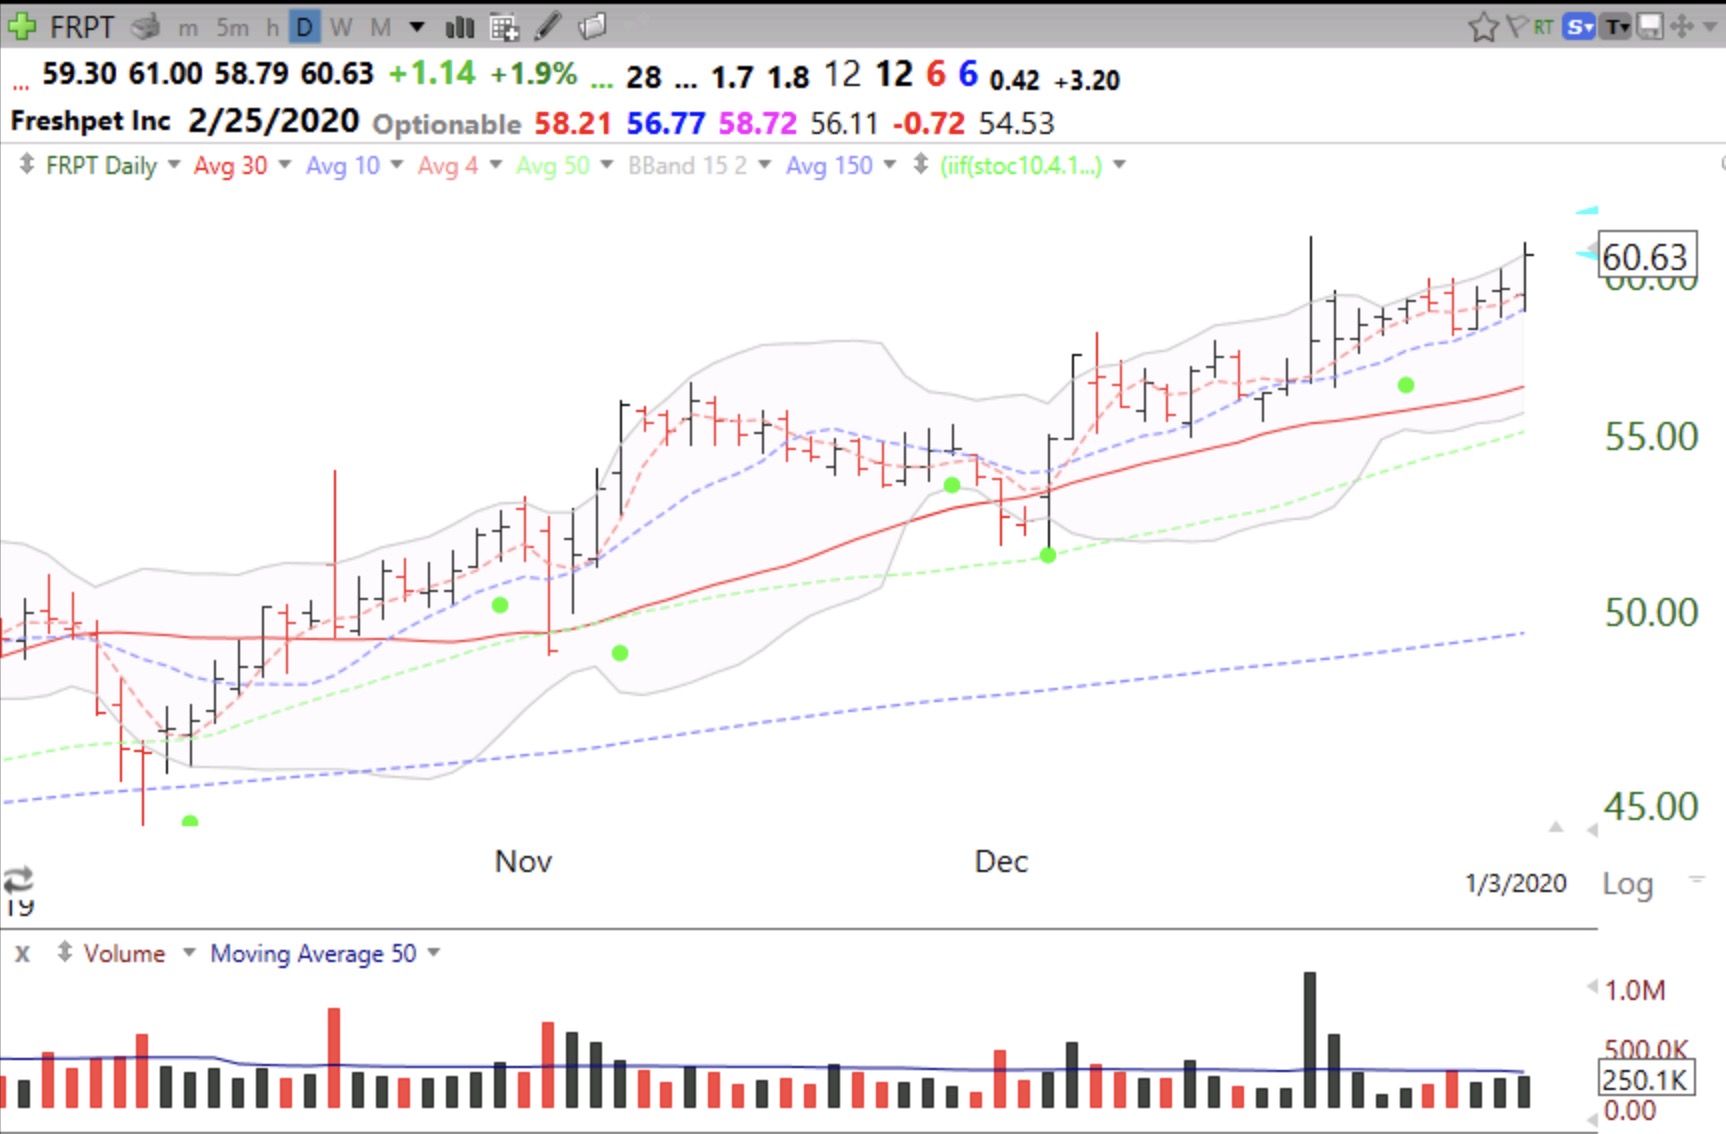
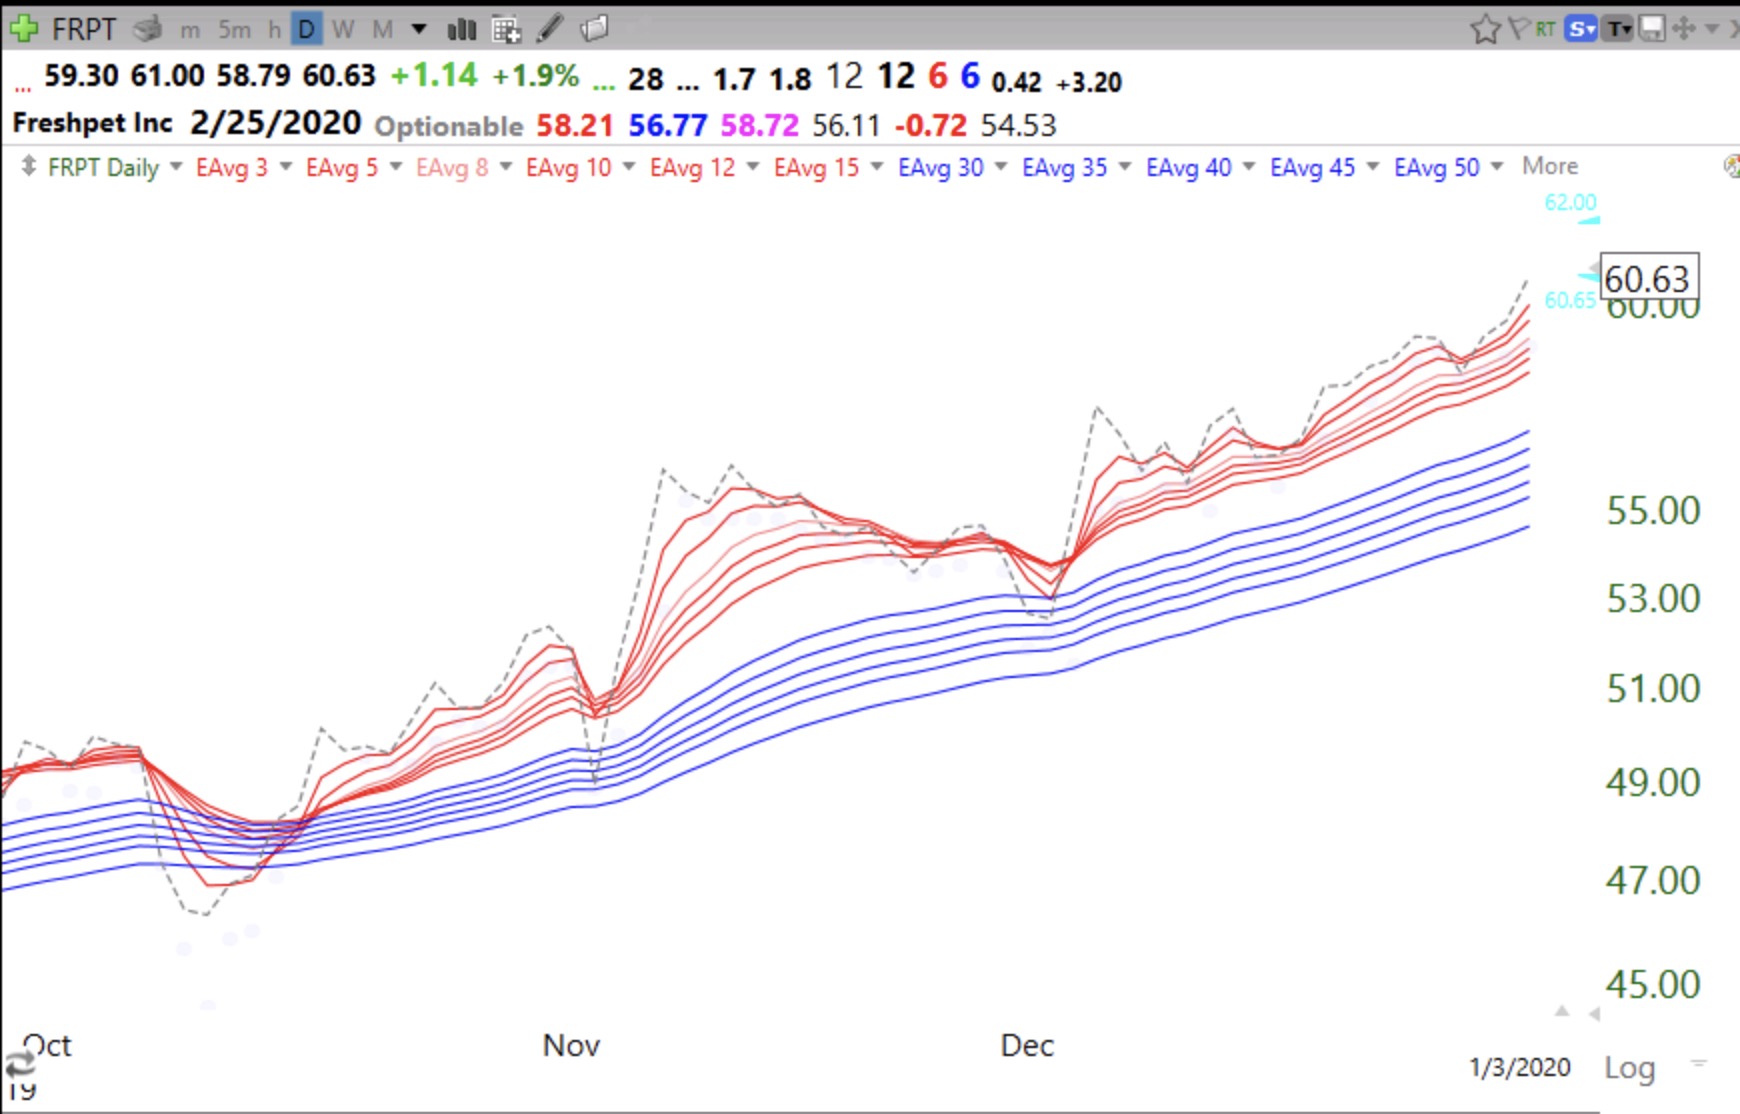
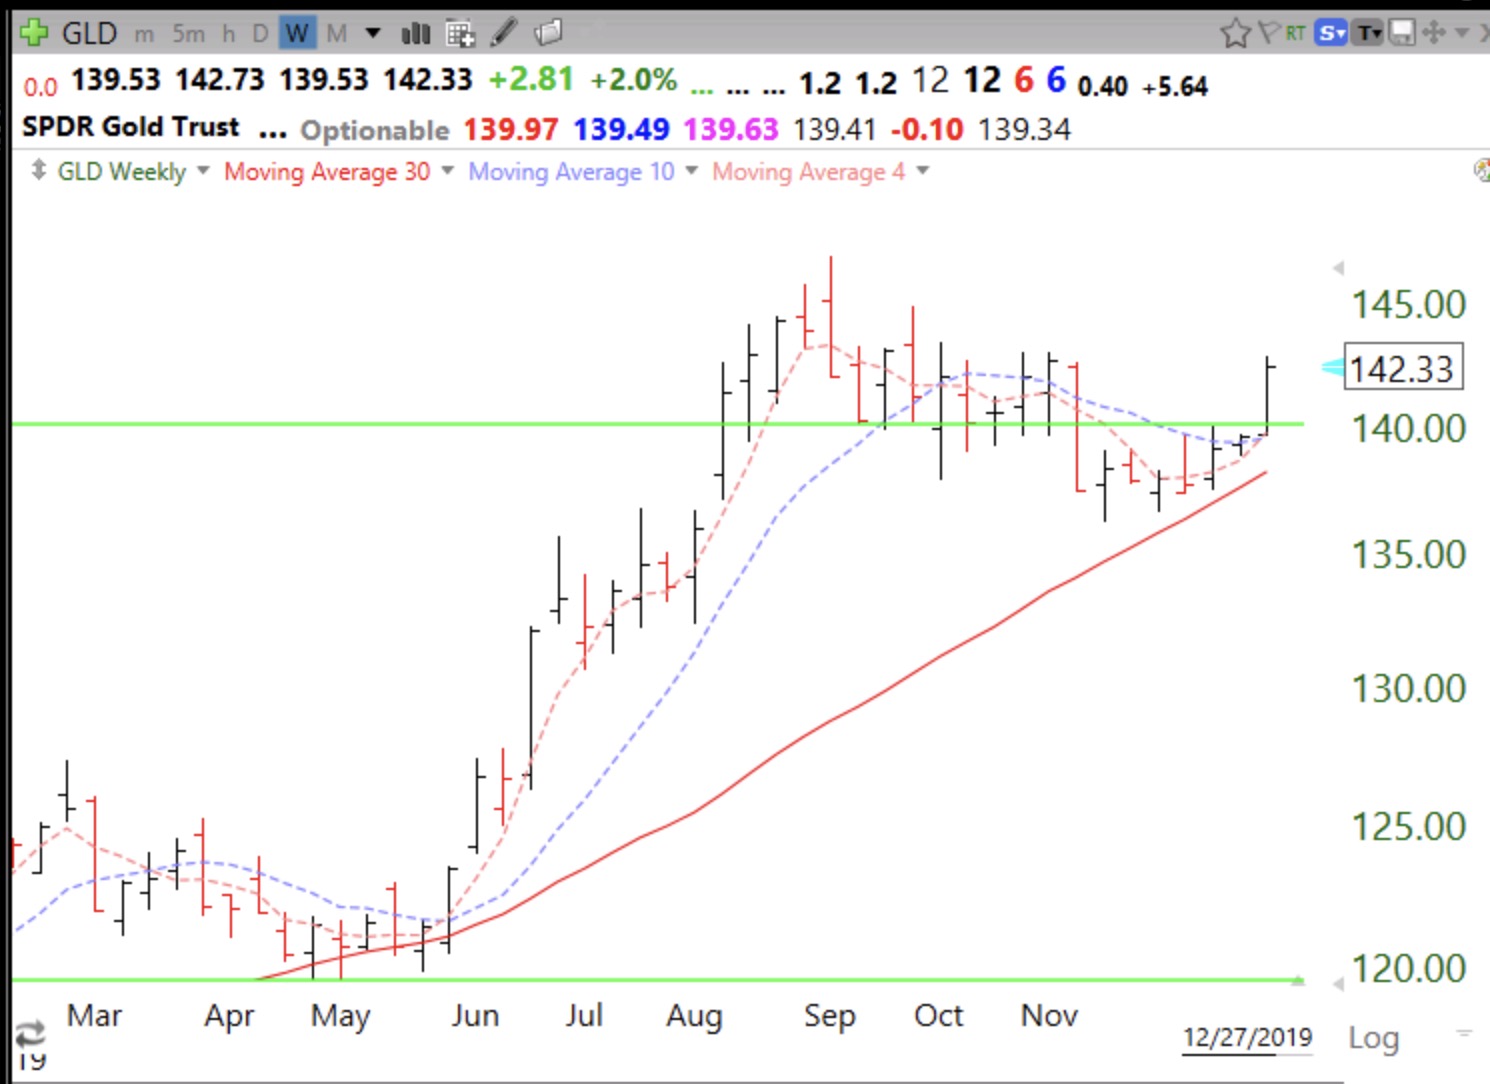
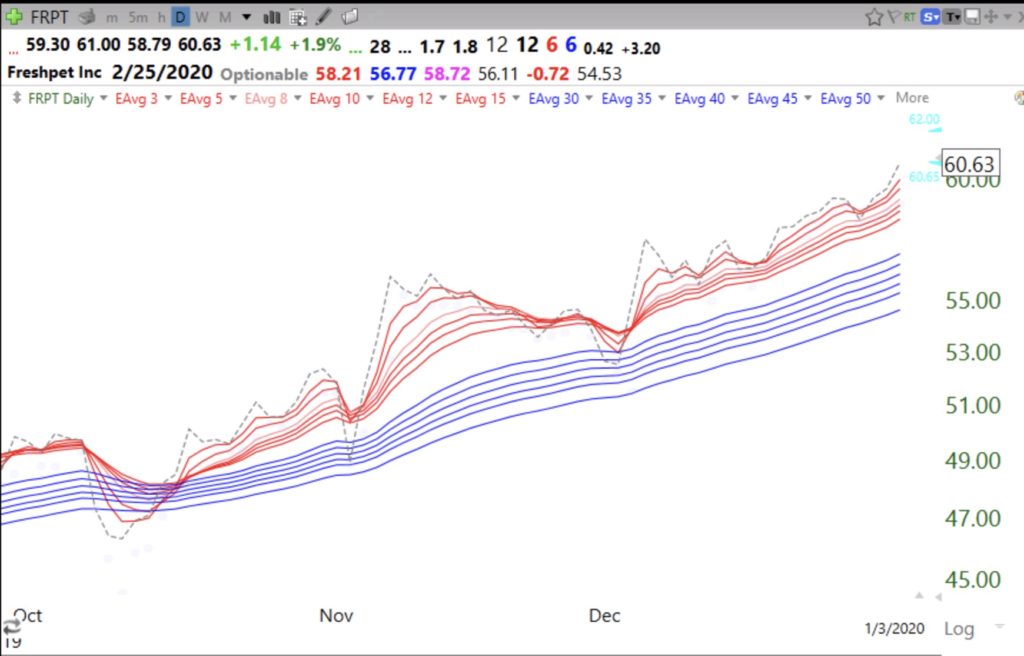
I learned that Freshpet had an IPO in November, 2014. opening at $19.75. It rose to $25.92 and then declined to $5.60 in February, 2016. From there it has gone almost straight up, closing at $60.63 on Friday. It is now trading above its second green line peak. I recently took a small position in FRPT after researching it on MarketSmith. I learned that while the company has been losing money, it is estimated to earn .01 per share in 2019 and a whopping .58 per share in 2020. Its quarterly sales have been increasing around 25%. On December 19th, FRPT hit an all-time high of $61.16 on the largest daily volume since last August. It then retraced but started back up and rose to $60.63 during Friday’s big decline. So I like FRPT’s technical and fundamental characteristics and every time I buy their food for Brady I think I am helping him and my investment. If FRPT trades at an all-time high this week or next, I will add to my position. Earnings are due out on February 25. I am not recommending FRPT, only illustrating the value of looking at a stock’s basic concept, fundamentals and technicals. Below are the monthly and daily charts for FRPT. An alternative investment is the pet care ETF, PAWZ, also near an all-time high, after a GLB.


FRPT also has a strong daily RWB pattern.
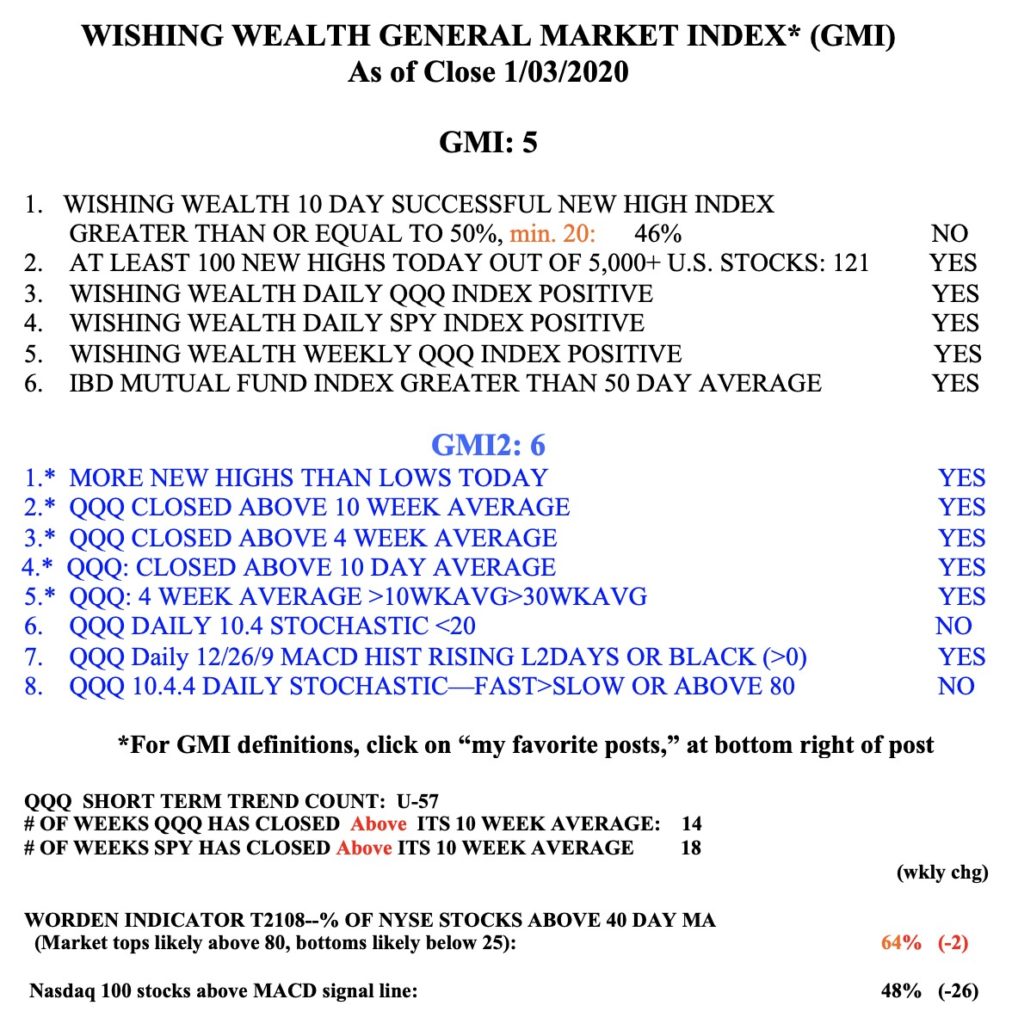
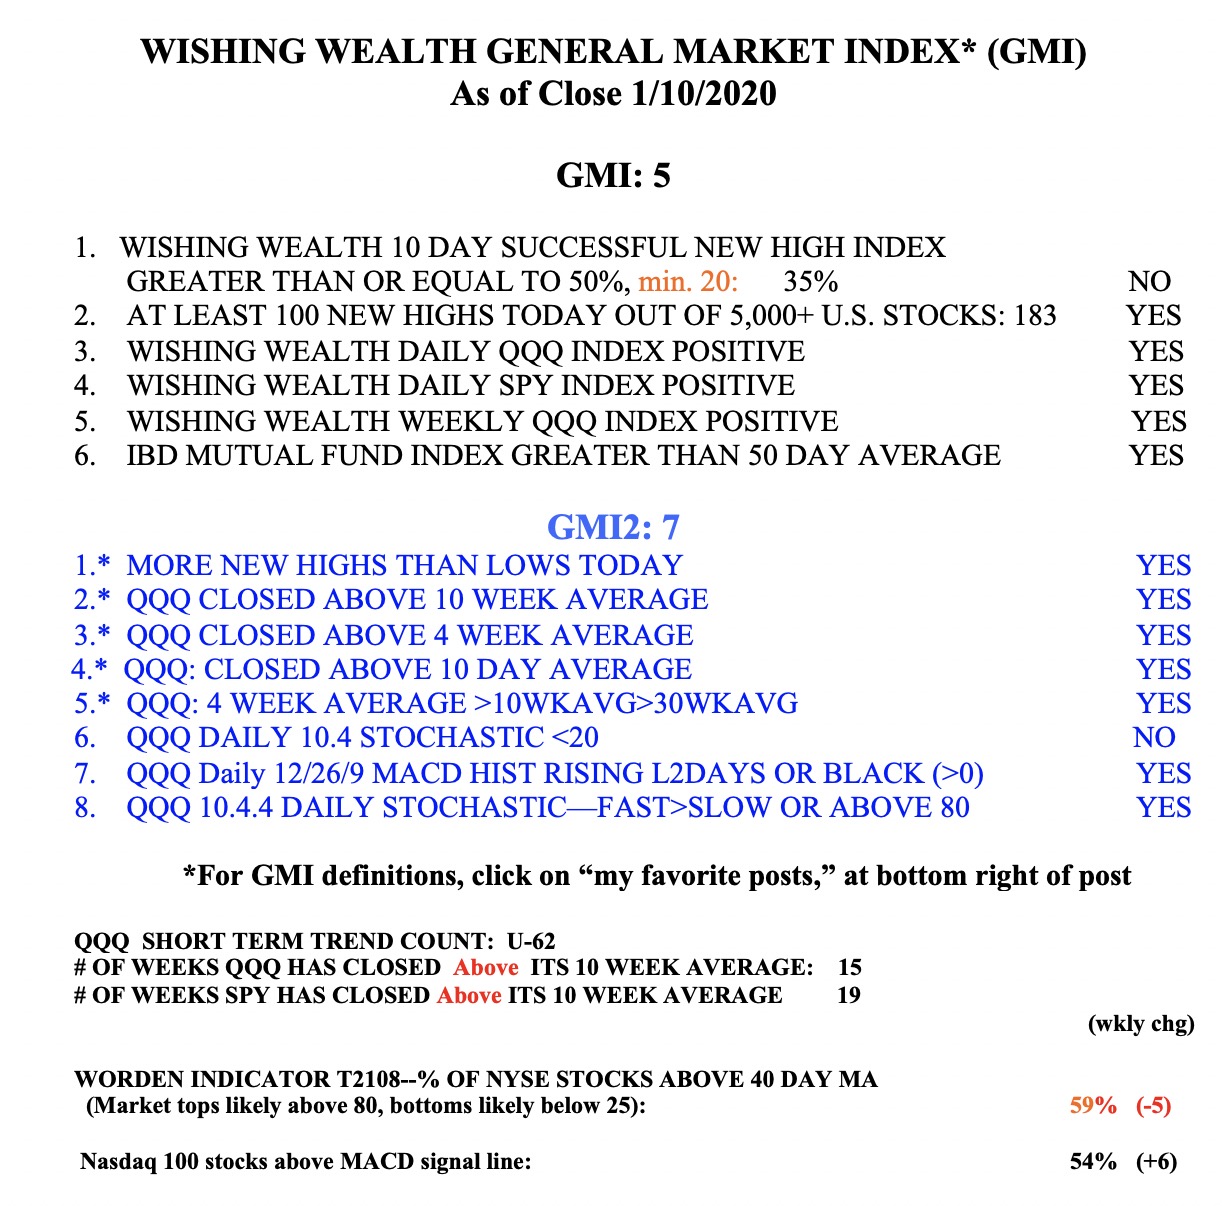
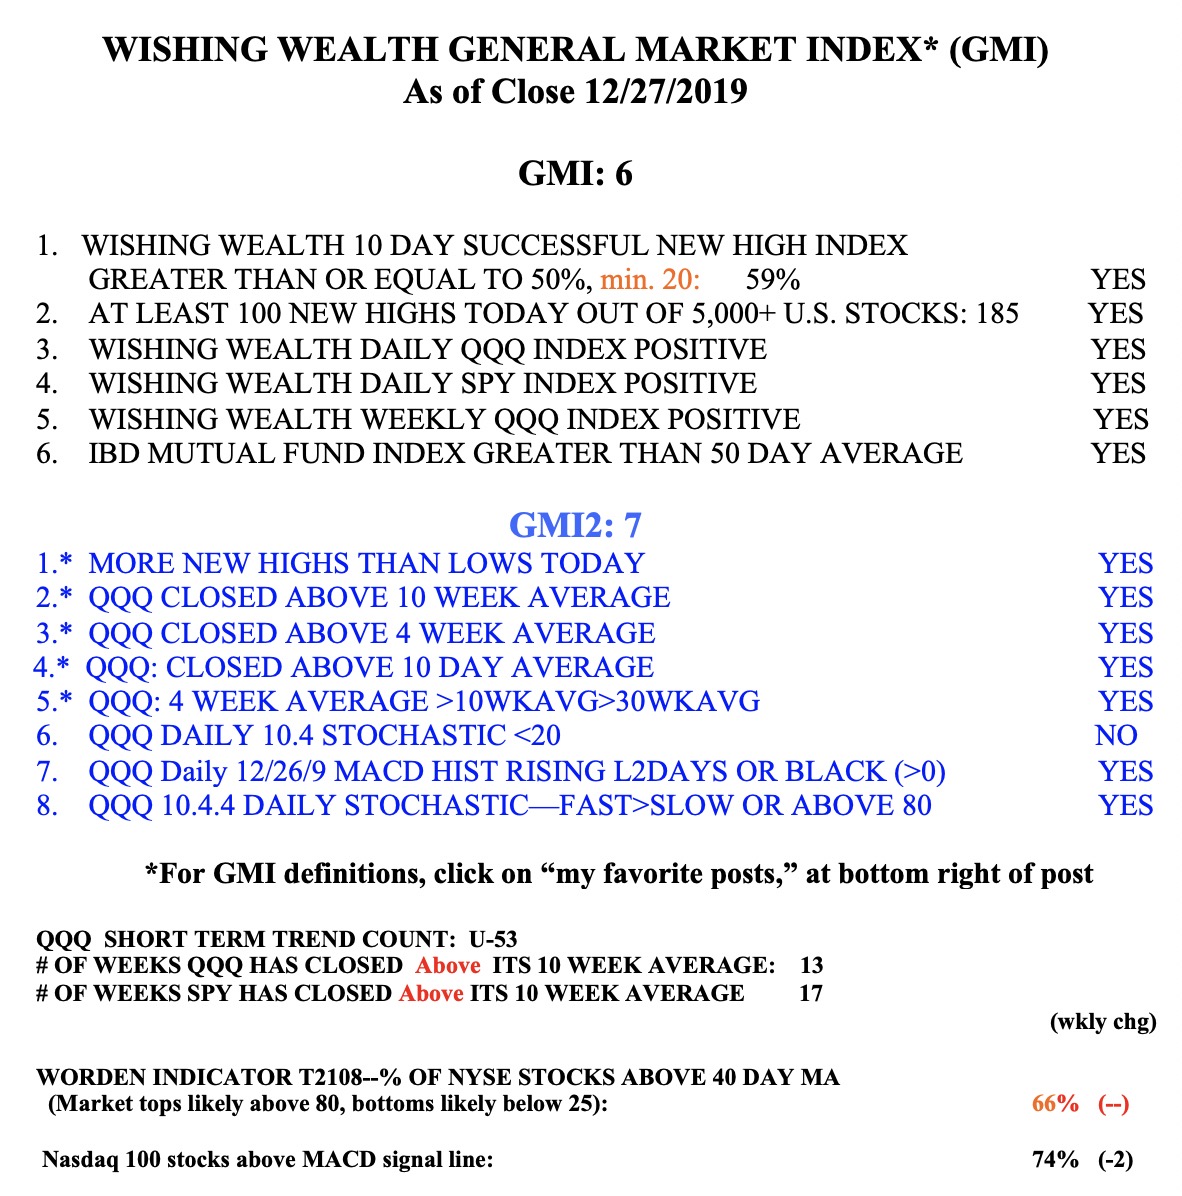
The GMI is at 5 (of 6) and on a Green signal. We will have to wait to see whether the current world turmoil will kill this up-trend.